AI Valuation Multiples Q1 2026: Investors Reprice Quality
AI valuation multiples in Q1 2026 did not move in one clean direction. They split.
The market continued to reward AI companies with clear monetization, repeatable demand, and improving unit economics. At the same time, companies still relying on category excitement, weak revenue quality, or unclear margin logic faced sharper discounts.
That is the main change visible across Finro’s Q1 2026 AI valuation dataset. Investors are no longer pricing AI as one broad category. They are separating infrastructure from applications, durable revenue from experimental demand, and companies with real operating leverage from companies still selling future potential.
This article summarizes selected insights from Finro’s AI Valuation Database and Benchmarks, which tracks public companies, private funding rounds, and M&A transactions across AI infrastructure, agents, vertical applications, enterprise platforms, and other emerging AI categories.
The full dataset includes company-level comps, revenue multiples, funding benchmarks, M&A transaction data, and segmentation by AI niche.
Three factors explain most of the dispersion in AI valuation multiples this quarter.
The first is monetization clarity. Revenue that is contracted, repeatable, and tied to a specific workflow is being valued more strongly than usage that is difficult to forecast or easy to churn.
The second is margin quality. Investors are paying closer attention to gross margin, contribution margin, and whether the business can sustain attractive economics once compute costs are fully reflected.
The third is durability. Retention, expansion, and sales efficiency increasingly separate companies that receive premium multiples from companies that are being repriced.
The following sections look at where these signals are most visible across the AI stack, including Core AI, Applied AI, agentic AI, public comps, private rounds, and M&A transactions.
-
Multiples split, not moved. AI valuations in Q1 2026 diverged sharply — premiums went to repeatable monetization and durable demand, while "growth now, business model later" got repriced.
-
Three markets, three filters. Public comps anchor what's defensible at scale, private rounds price scarcity-driven upside, and M&A enforces what's actually monetizable under real operating conditions.
-
Core AI vs Applied AI. Core earns premiums when it becomes picks-and-shovels infrastructure others must build on. Applied earns premiums when embedded in budgeted workflows with measurable ROI and repeatable deployment.
-
Execution risk is now priced explicitly. Fewer "ifs" in the story translates directly into higher multiples — even when growth is slightly slower.
Topics covered in this article +
- What actually widened dispersion in Q1 2026?
- How do founders and investors apply these multiples?
- Related AI valuation research and cross-market context
- Agentic AI moved from narrative to early monetization, with uneven proof
- Core AI vs. Applied AI: valuation follows distribution and monetization
- What the market rewarded inside Core AI
- What the market rewarded inside Applied AI
- The practical implication: "core vs. applied" as underwriting shorthand
- Where multiples diverge across AI segments
- The Q1 shift: public repricing, M&A anchoring, private upside
- Download the Q1 2026 AI multiples dataset
- Summary: Dispersion is the signal
- Key takeaways
- Answers to the most asked questions
What actually widened dispersion in Q1 2026?
Dispersion did not widen because investors suddenly changed their view on “AI.” It widened because the market got stricter about what qualifies as underwritable performance.
In practice, Q1 2026 pricing looked less like a single AI multiple range and more like a set of separate lanes. Companies in the top lane were not just growing. They were showing that growth can persist without exponential burn, margin erosion, or fragile demand. Companies outside that lane were still able to point to momentum, but the market treated it as provisional.
Three mechanisms drove most of the spread.
Proof replaced promise as the primary underwriting input
Many AI companies can show impressive product velocity and headline growth, especially early. The repricing happened when investors started asking whether that growth is repeatable under real constraints.
The highest outcomes clustered around evidence that demand is durable and monetization is real, such as:
Clear willingness to pay, not just usage
Retention that holds once novelty fades
Expansion that comes from workflow value, not discounts or heavy services
Predictable sales motion, even if it is still maturing
The discounts clustered around patterns that still read like “learning mode,” such as:
Revenue that is tightly coupled to ongoing incentives or heavy customization
Demand that depends on a narrow set of pilots or one buyer archetype
Weak renewals masked by new logo growth
This is where the gap forms. Two companies can grow at similar rates, but the one that demonstrates repeatability earns a fundamentally different multiple.
This update synthesizes signals from Q1 2026 public-market comps, disclosed private rounds, and recent M&A benchmarks across the AI stack. The focus is on valuation dispersion and the operating attributes investors appear to reward: monetization clarity, durability of demand, and improving unit economics. Coverage is directional rather than exhaustive. Multiples can move quickly with sentiment, liquidity, and compute costs, so treat point-in-time benchmarks as context, not a pricing guarantee.
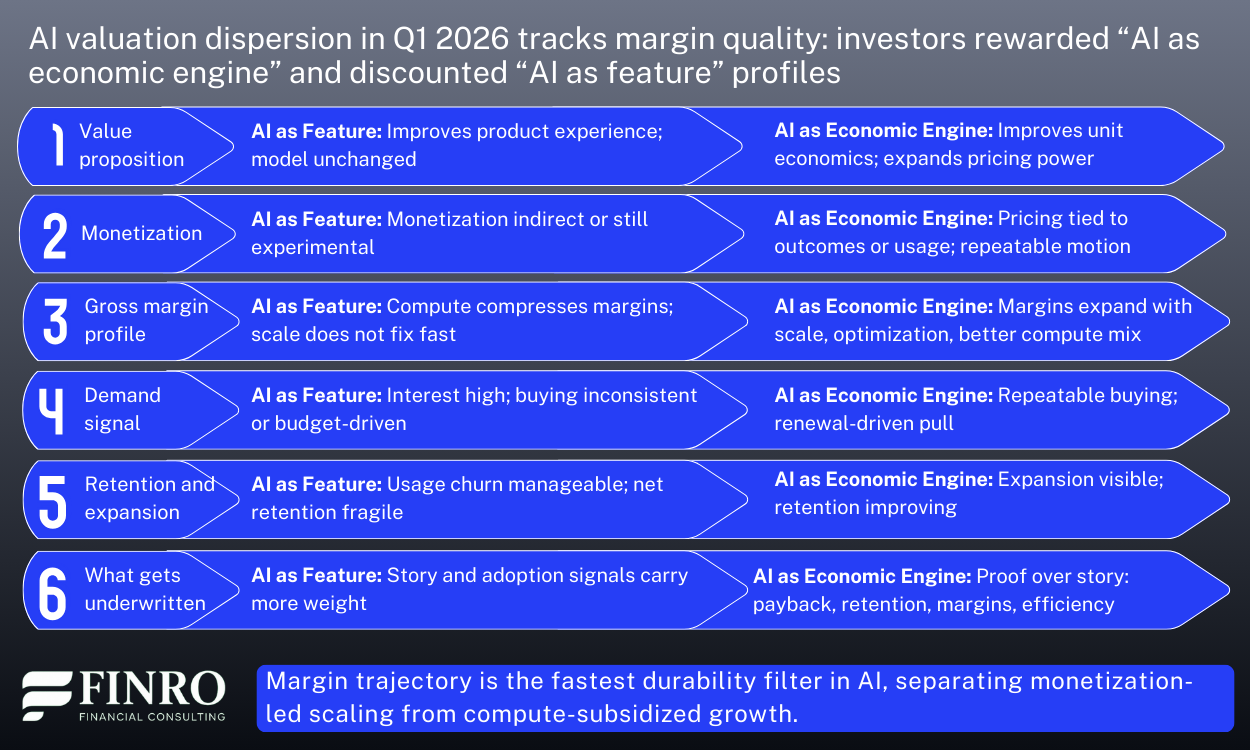
Margin quality and compute exposure started to matter more than category labels
In Q1 2026, the market continued to separate “AI as feature” from “AI as economic engine.” The question was not whether AI is inside the product. The question was whether AI improves the business model or strains it.
Companies with improving gross margin profiles, or at least a clear path to improvement, tended to be rewarded. Companies where revenue still looked partially subsidized by compute were treated more cautiously, even with strong growth.
That is not a moral judgment about using compute to grow. It is a recognition that the multiple is a bet on future cash generation. When unit economics are unclear, the multiple becomes a smaller bet.

Efficiency became a valuation lever again
The market’s tolerance for high burn did not disappear, but the bar for “good burn” rose. Q1 2026 multiples tended to widen most where growth efficiency diverged.
Investors were effectively asking:
Does every incremental dollar of revenue require proportional spend?
Are CAC and payback improving, stable, or deteriorating?
Is growth coming from scalable channels and repeatable sales cycles?
Does the business get easier to scale over time, or harder?
This is one reason the same growth rate can produce very different outcomes. Growth that gets cheaper to generate deserves a higher multiple than growth that gets more expensive.
The practical implication: dispersion is the market’s way of pricing execution risk
When investors reprice quality, they are really repricing execution risk. Q1 2026 multiples increasingly reflected how many “ifs” remain in the story.
Fewer “ifs” translates into higher valuation outcomes, even if growth is slightly slower.
More “ifs” translates into discounts, even if growth looks strong on paper.
This sets up the rest of the analysis. The remainder of the article breaks down where those “ifs” tend to concentrate across the AI stack, starting with the split between Core AI and Applied AI, and why defensible distribution and workflow ownership became more central to valuation outcomes in Q1 2026.
How do founders and investors apply these multiples?
Valuation benchmarks like these rarely sit in isolation. In practice, founders and investors use structured multiples to test fundraising narratives, evaluate strategic options, and align expectations across boards, acquirers, and capital providers.
At Finro, these datasets are integrated into broader valuation advisory engagements, financial models, and M&A positioning work. The objective is not only to reference market ranges, but to understand where a company fits within them — and how shifts in efficiency, growth, and product focus influence valuation outcomes.
Learn more about Finro’s valuation advisory work.
Agentic AI moved from narrative to early monetization, with uneven proof
Agentic AI was one of the loudest themes in Q1 2026, but the valuation signal was quieter and more discriminating. The market did not price AI agents as a category premium. It priced evidence that agents can be sold, deployed, and expanded without collapsing unit economics.
That distinction matters because agentic products sit at an awkward intersection of promise and cost. They can be sticky once embedded in workflows, but they can also be compute intensive, operationally complex, and harder to scope than classic SaaS. In Q1, the companies that held up best were the ones that treated “agentic” as a delivery mechanism, not the business model.
What investors started rewarding in agentic profiles
1) Clear packaging and billing, not open-ended usage
The cleanest outcomes came where pricing was anchored to a business unit that finance teams can approve and renew. Think seats plus tiered usage, or outcome-aligned metrics with guardrails. The opposite profile, broad “pay for tokens” narratives without tight controls, got discounted because buyers struggled to forecast spend and teams struggled to forecast margins.
2) Narrow workflows with repeatable deployment
The strongest commercial signal came from agents that do one job reliably, in a known environment, with an implementation path that can be replicated. Investors treated narrowness as a feature, not a limitation, because it translated into shorter cycles, lower services drag, and clearer post-sale expansion.
3) Proof of expansion inside existing accounts
In Q1, “pilot wins” mattered less than expansion motion. Investors leaned into questions like: Do deployed agents spread to adjacent teams? Do they take on additional tasks without heavy customization? Are renewals behavior-driven rather than champion-driven? Where the answers were credible, valuation outcomes improved even when headline revenue was not yet large.
4) A margin story that improves with learning and scale
Agentic products tend to start with a heavier compute and support footprint. The market showed more willingness to underwrite that if the company could explain why gross margin should expand, and show early evidence that it is happening. Examples include model routing, caching, better prompt and tool orchestration, and reducing human-in-the-loop over time. The key was trajectory.
Where the market stayed skeptical
1) “Agent as a demo” without a procurement narrative
Many products looked compelling in a controlled environment but struggled to translate into budgeted, renewable spend. When buyers treat the agent as experimental, the revenue tends to be fragile. Investors priced that fragility.
2) Implementation that looks like bespoke services
If each deployment requires heavy tailoring, deep integrations, or ongoing ops support, the agent starts to resemble a project business. That can still work, but it compresses multiples unless the company can show a credible path to standardization.
3) Margins obscured by compute volatility
Where compute costs were a meaningful swing factor and the company could not explain controls, unit economics became a reason to wait. In Q1 2026, “we will fix it later” did not clear the bar as often.
The takeaway for founders and investors
Agentic AI is not being valued for the word “agent.” It is being valued for repeatable deployment, controlled economics, and expansion inside accounts. The winners in Q1 looked less like general-purpose copilots and more like workflow machines with disciplined packaging.
If you are building in agentic AI, the fastest way to move from category interest to valuation support is to show three things together: a billable unit buyers can renew, expansion evidence post-deployment, and a gross margin trajectory that improves as usage scales.

Core AI vs. Applied AI: valuation follows distribution and monetization, not “model sophistication”
Core AI and Applied AI did not converge in Q1 2026. The gap widened, and the reason is simpler than it sounds. Investors are not pricing technical sophistication. They are pricing commercialization certainty: how predictable is the revenue, how defensible is the position, and how clearly does the business compound over time.
Core AI carries two persistent valuation headwinds. Differentiation erodes as models improve and open alternatives close the gap. And monetization is structurally constrained when the product is sold as a broad platform rather than tied to a specific workflow. Applied AI sidesteps both — not because it is technically easier, but because it attaches to existing budgets, defined buyers, and operational outcomes that are easier to underwrite.
Models, infrastructure, training, inference, and developer tooling. Judged on performance, cost curve, and platform leverage — valued when it becomes picks-and-shovels infrastructure others must build on.
AI delivering specific outcomes inside defined workflows and verticals. Judged on repeatability, retention, and ROI — valued when embedded in budgeted workflows with measurable outcomes and a renewal path.
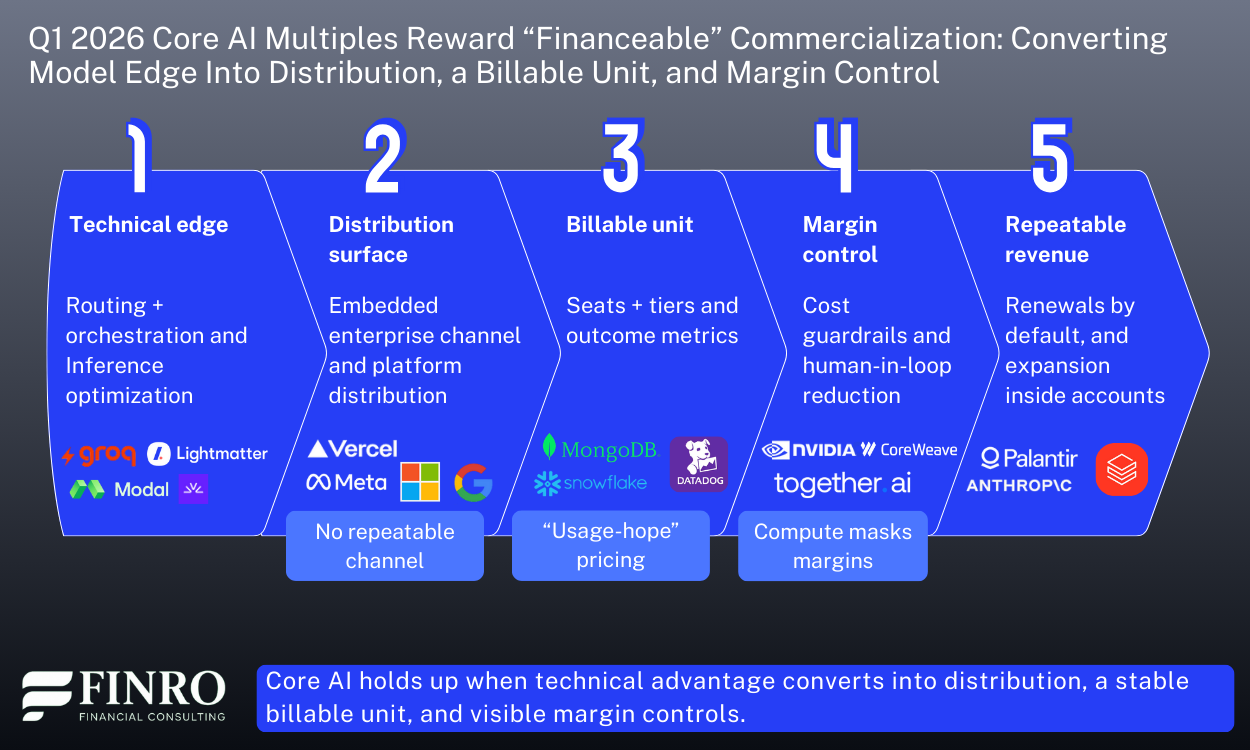
What the market rewarded inside Core AI?
The strongest Core AI outcomes in Q1 were not explained by model performance. They were explained by distribution.
Companies with embedded enterprise relationships, platform reach that expands usage without proportional sales cost, or a product surface that others must build on top of, those cleared better multiples.
The second factor was economic legibility: investors wanted to see gross margin drivers explained with specificity, and a billing model anchored to something buyers can forecast and renew rather than open-ended token consumption.
What the market rewarded inside Applied AI?
Applied AI cleared the bar more consistently when it was embedded in a defined workflow with a buyer, a budget, and a renewal path.
The premium showed up where AI was packaged as a product with measurable ROI, not as an experiment. Vertical depth mattered: companies with domain-specific data advantages and integration into systems of record produced valuation support even when growth was not the fastest in the set.
The expansion pattern investors looked for was consistent: land narrow, expand to adjacent workflows without heavy services drag, and show that renewals happen because of workflow value, not because of a champion relationship.
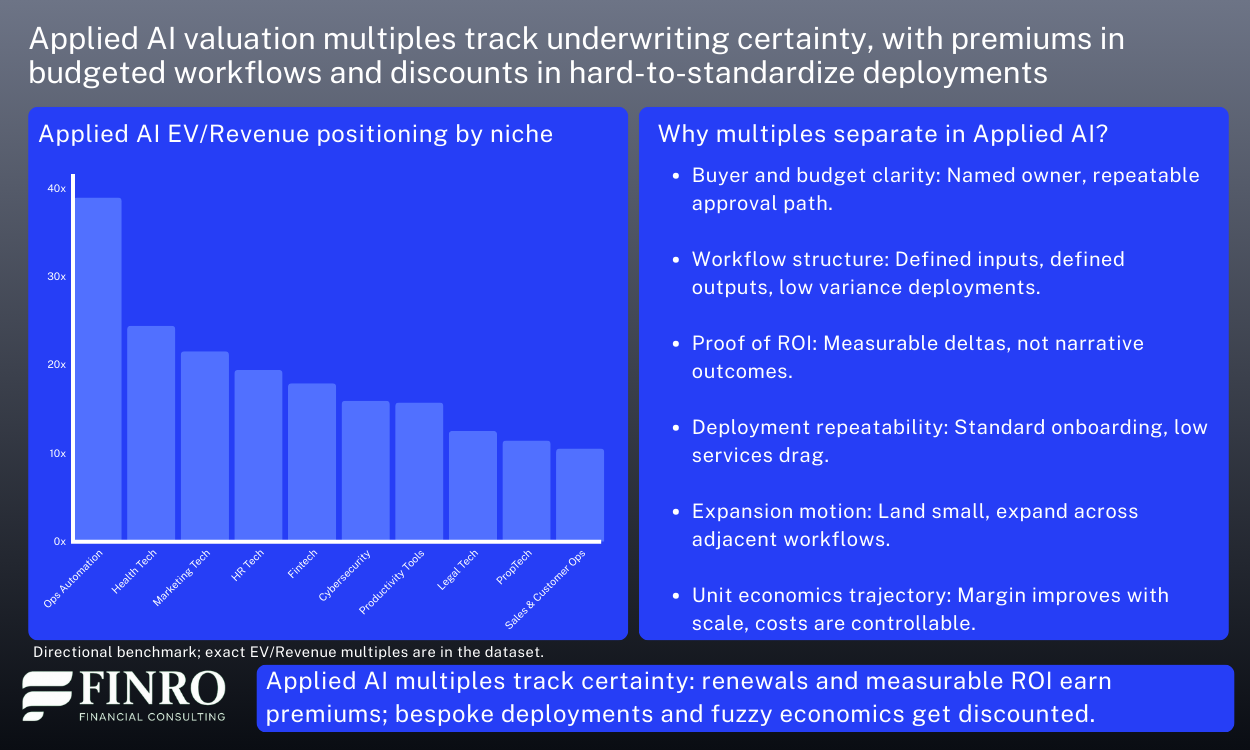
The practical implication: “core vs. applied” is becoming a shorthand for underwriting certainty
The core vs. applied distinction is increasingly how investors compress a lot of diligence into one question: how predictable is commercialization?
In Q1 2026, the market paid less for technical ambition and more for proof that the business compounds. Core AI faces questions about durability and pricing power. Applied AI faces questions about distribution, scalability, and retention.
Whichever side of the stack you operate in, the translation is the same, make the business legible in the terms investors are using right now: distribution, billable unit, retention, and margin trajectory.
Where multiples diverge across AI segments?
So far, the pattern has been consistent: AI multiples in Q1 2026 did not move in one direction. They separated based on underwriting certainty.
Premium outcomes clustered around repeatable monetization, improving unit economics, and durable demand. Discounts hit companies where revenue is harder to forecast, compute still obscures margins, or growth still requires proportional spend.
This section makes that dispersion legible by combining two lenses: a practical niche taxonomy and cross-market triangulation.
A taxonomy that matches underwriting, not buzzwords
A taxonomy is only useful if it maps to how investors price risk. The goal is not to list every niche. It is to group the market by what drives valuation outcomes: where margin pressure comes from, how predictable the buying motion is, and whether deployments scale cleanly.
Your dataset taxonomy already does that across the stack, from foundation and infrastructure layers (Infrastructure, LLM Vendors) to data and retrieval layers (Data Intelligence, Search Engine) and workflow-facing applications (Cybersecurity, Fintech, Health Tech, Legal Tech, HR Tech, Marketing Tech, Sales & Customer Ops, Productivity Tools, PropTech, Computer Vision, AI Robotics).
This is also why the long niche list earlier can go. Readers do not need an index. They need the logic of why these groups clear differently.
Cross-market triangulation: how public, private, and M&A “vote” on quality
Valuation signals do not come from one market in isolation. Public comps, private rounds, and M&A each price risk differently. The useful signal is how they align.
Public markets are typically fastest to punish margin opacity and weak efficiency. When dispersion widens in public comps, it is usually because the market stops underwriting “future operating leverage” without evidence.
Private rounds can lag public repricing and still support premium outcomes, but dispersion inside private has become a clear test of “fundable quality.” Similar growth rates clear at very different outcomes depending on whether revenue is repeatable, margins have a believable path, and go-to-market is becoming more predictable rather than more bespoke.
M&A is the most pragmatic market. Strategic buyers tend to pay for assets they can integrate and scale: workflow ownership, distribution fit, and economics that hold under real usage. Where deployments look like bespoke services or compute costs remain uncontrolled, M&A benchmarks tend to be more conservative.
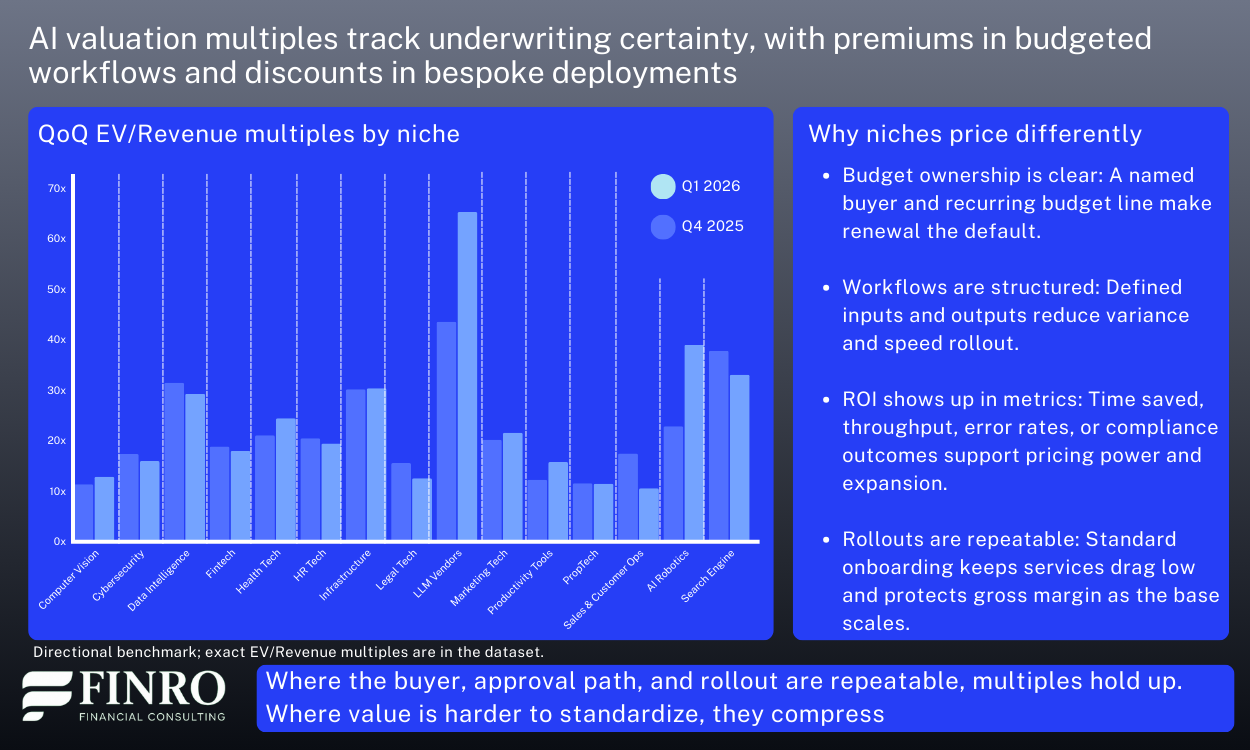
The Q1 shift: public repricing, M&A anchoring, private upside
A quarter-over-quarter view is useful precisely because it removes the “AI is up/down” framing. From Q4 2025 to Q1 2026, pricing did not move as one market. The direction depended on the lens. Public comps repriced more visibly, private rounds continued to support upside selectively, and M&A stayed the most grounded reference point.
At the aggregate level, the split is straightforward. Public multiples stepped up quarter over quarter, private moved modestly higher, and M&A was broadly stable. That combination fits a market where public comps are re-rating a narrower set of “bankable” exposure, private investors are still underwriting scarcity, and acquirers continue to price to ROI and integration reality.
Public repricing was concentrated, not broad. The clearest step-change showed up in LLM vendors, and health tech also moved meaningfully higher in public comps. Infrastructure held up with a modest increase, consistent with continued confidence in picks-and-shovels exposure. In contrast, data intelligence, marketing tech, and productivity tools compressed in public multiples, which aligns with categories where differentiation and pricing power can be harder to defend across the full peer set.
Private upside stayed alive, but became more selective. The most notable private increases came in marketing techand productivity tools, even as public comps in those areas did not move the same way. That pattern typically signals “winner pricing” in private markets for a handful of leaders, while public markets anchor the broader category more conservatively. Several other segments were flat or down in private marks, reinforcing that premiums are narrowing to profiles that can compound with improving economics.
M&A continued to anchor. Across most segments, deal multiples were stable quarter over quarter, which is exactly what you would expect from the most pragmatic filter. Buyers reprice slowly because acquisitions must clear integration cost and ROI, not narrative. Where M&A did move, it reinforced that the bar remains high: legal techcleared at lower levels, while cybersecurity continued to hold up.
Net, the QoQ view supports the same takeaway as the rest of this update. Dispersion is not noise. It is the market applying three different tests at once: public markets re-rate what looks defensible, private markets pay for scarce upside, and M&A enforces what is monetizable under real operating constraints.
Using AI valuation benchmarks for a real fundraising, M&A, or investor decision? Finro helps founders, CFOs, investors, and buyers apply AI niche, business model, revenue quality, margin profile, public comps, private rounds, and M&A data to company-specific valuation analysis.
Download the Q1 2026 AI multiples dataset
If you want to go deeper than directional charts and narrative signals, the full reference set is available as a downloadable dataset.
Finro’s Q1 2026 AI valuation multiples database consolidates public comps, private rounds, and recent M&A into one structure, organized so you can benchmark a company the way investors actually triangulate pricing.
It is not a “one-number” view of AI. It is segmented by niche, split by market type, and designed to show where pricing holds up across public, private, and deal reality.
The dataset includes:
A company-level table spanning public, private, and M&A observations, with consistent fields to support peer selection and filtering.
Core AI and Applied AI cuts, aligned to the same taxonomy used in this article.
Summary tabs by niche and by funding round, so you can sanity-check valuation ranges against stage and business model.
A quarter-over-quarter niche view (Q4 2025 vs Q1 2026) to see which segments repriced, which stayed anchored, and where dispersion widened.
Typical uses include: building a comps set for a fund memo, pressure-testing a round narrative against public anchors and deal clears, and explaining to a board why two “AI companies” with similar growth can land at very different outcomes once revenue quality, margins, and underwriting certainty are priced in.
Summary: Dispersion is the signal
AI valuation multiples in Q1 2026 did not move together. They separated — and the separation is the point.
The market is not repricing "AI." It is repricing execution certainty. Companies with repeatable monetization, durable demand, and improving unit economics earned premiums. Companies still selling promise over proof got discounted, often sharply, regardless of headline growth.
Public comps, private rounds, and M&A each applied a different version of the same test. Public markets anchored what looks defensible at scale. Private rounds priced upside where scarcity and category leadership felt plausible. M&A enforced what is actually monetizable under real operating conditions.
The result is not a single AI multiple. It is a set of separate lanes, priced by where a company sits in the stack, how defensible that position is, and how cleanly its revenue converts into durable economics.
That is what dispersion looks like when a market gets stricter. It is not a warning sign. It is the market doing its job.
- 1 Multiples diverged sharply. Investors repriced revenue quality, not category hype. The same growth rate produced very different outcomes depending on monetization clarity and durability.
- 2 Three factors drove premium outcomes. Monetization clarity, improving unit economics, and durable retention separated companies that held multiples from those that compressed.
- 3 Agentic AI rewarded execution, not narrative. Repeatable deployment, controlled pricing, and post-pilot expansion earned multiples. Demos and bespoke rollouts got discounted.
- 4 Core vs Applied is an underwriting question. Core AI is valued for distribution leverage and picks-and-shovels positioning. Applied AI is valued for workflow ownership, budgeted renewals, and expansion motion.
- 5 Three markets, three filters. Public comps anchor what is defensible at scale, private rounds price scarcity-driven upside, and M&A validates what is truly monetizable under real operating conditions.