Fintech startup valuations in 2025 vary widely by funding stage and business model, with early rounds pricing high on potential and later stages favoring efficiency and fundamentals. Valuation multiples often peak at Series A–C, then normalize as companies mature. Infrastructure-heavy niches like Capital Markets and SMB Fintech command higher multiples than consumer-facing or volatile segments like Payments and Crypto.
The most common valuation method is EV/Revenue, especially in early stages, while EV/EBITDA and EV/Funding are used in later rounds or for low-revenue companies. Data from 360 fintech companies reveals how investors assess growth, risk, and value across public, private, and M&A deals.
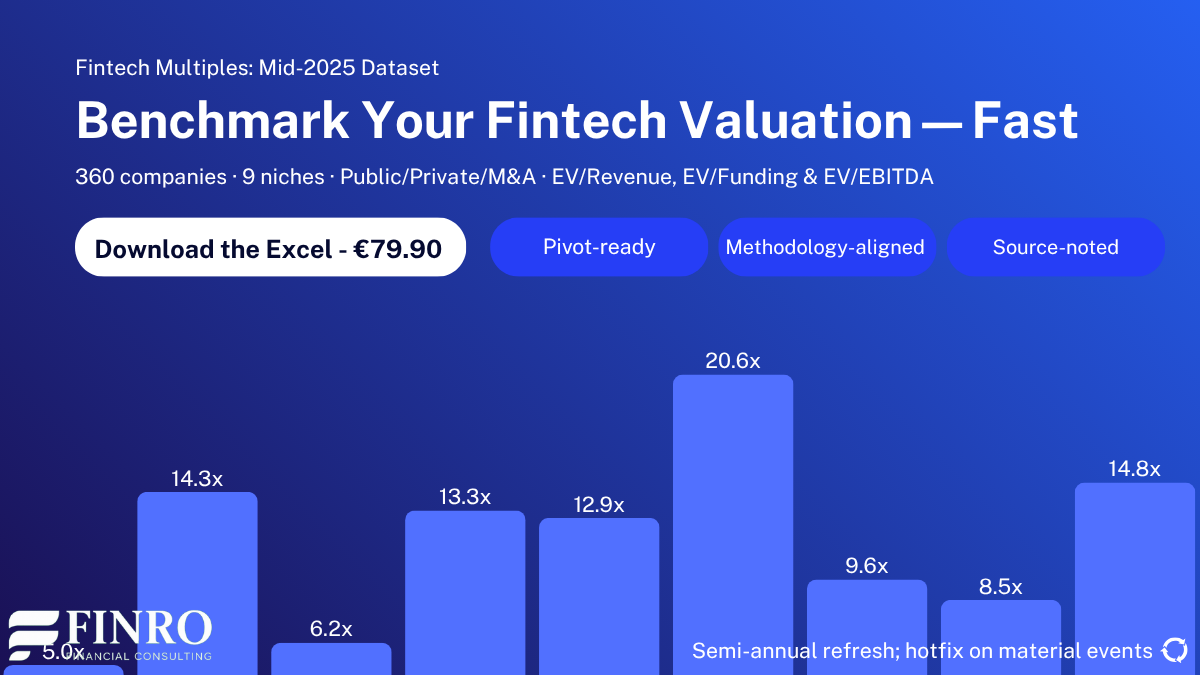
Fintech Valuation Multiples Mid-2025: Benchmarks Across 9 Fintech Niches
Author
Lior Ronen
Founder of Finro Financial Consulting. Personally leads every valuation, modeling, and M&A advisory engagement.
View Lior's profile →
Analysis by
Finro Financial Consulting
Startup valuation, financial modeling, and M&A advisory for AI, fintech, and SaaS companies. Serving funded tech startups from pre-seed through pre-IPO.
About Finro →This update summarizes selected insights drawn from Finro’s Fintech valuation database covering public companies, private startups, and M&A transactions.
Fintech valuation dispersion remains pronounced in 2025. Companies with similar growth profiles often clear at materially different multiples, reflecting shifts in capital efficiency, revenue durability, and category positioning rather than headline momentum alone.
Market comps remain useful only when the underlying data is current, clearly segmented, and grounded in actual transactions. To ground the analysis, we reviewed 360 fintech companies across private funding rounds, public market comparables, and M&A deals, grouped into nine core categories spanning lending, neobanks, wealthtech, insurtech, crypto, and B2B infrastructure.
For founders preparing to raise, investors benchmarking a deal, or corporate teams evaluating strategic positioning, the dispersion highlighted here changes how valuation conversations are framed in practice.
Each observation includes financials, valuation multiples, and round context, allowing founders, investors, and advisors to benchmark outcomes against real market signals rather than generalized narratives.
TL;DR
Topics covered in this article
- Mapping the Fintech Landscape: 9 Niches That Matter
- How Founders and Investors Apply These Multiples
- Related Fintech valuation research and market context
- How Valuation Shifts by Round
- How Fintech Companies Are Valued
- What Niche You’re In Still Matters
- Dig Deeper: Explore the Full Dataset
- Key Takeaways
- Answers to The Most Asked Questions
Mapping the Fintech Landscape: 9 Niches That Matter
Fintech is not a single market with shared rules or valuation benchmarks. It’s a group of distinct verticals, each shaped by different monetization models, customer types, and regulatory conditions.
To make sense of the 360 companies included in this mid-year update, we’ve organized them into nine core niches. Here’s how they break down:
Payments & Transfers
This category includes companies that help move money between people and businesses. It covers online payment processors, digital wallets, mobile point-of-sale systems, cross-border remittance services, and merchant acquiring platforms.
These businesses typically generate revenue from transaction fees, volume-based pricing, or interchange. While competition is intense, the scale opportunity is significant, especially for platforms with strong network effects or deep integration into retail and e-commerce channels.
Lending & Credit
Companies in this niche focus on originating, distributing, or managing credit. That includes providers of Buy Now, Pay Later services, SME lending platforms, consumer credit enablers, and companies offering non-traditional underwriting tools. Many use alternative data and automation to reach underserved borrowers.
Business models vary; some hold loans on their balance sheet while others rely on third-party capital. Valuations depend heavily on credit performance, funding structure, and how well the business manages risk.

Banking & Neobanks
Digital banks and banking platforms that serve individuals or businesses without physical branches. These companies typically offer checking or savings accounts, debit cards, budgeting tools, and sometimes credit products. Revenue is often tied to interchange fees, premium subscriptions, and lending overlays.
While acquisition costs can be lower than traditional banks, profitability often takes time. Investors usually focus on growth metrics, user engagement, and the ability to scale core banking services efficiently.
WealthTech & Robo-Advisors
Platforms designed to help users invest, save, or manage their finances. This includes automated investing tools, portfolio tracking software, alternative asset platforms, and apps offering fractional ownership in stocks, real estate, or other instruments.
Revenue is commonly based on assets under management or fixed monthly fees. The most attractive companies combine user-friendly interfaces with efficient investment engines. Valuation tends to reflect both AUM growth and the scalability of the tech behind it.
InsurTech
This group includes startups working to improve how insurance is priced, distributed, and serviced. Some operate as full-stack carriers, while others offer digital brokerage, underwriting tools, or claims automation.
The sector spans life, health, auto, home, and commercial insurance. Since underwriting profitability can take years to prove, early valuations often emphasize distribution scale, automation, and claims efficiency over earnings. Growth is critical, but execution and customer retention matter just as much.
Blockchain & Crypto
Companies in this space are building infrastructure and products for the digital asset economy. That includes trading platforms, custody providers, blockchain developers, DeFi protocols, and token issuance systems.
Business models vary widely and are still evolving. Some companies generate revenue from trading spreads or infrastructure licensing, while others rely on token incentives. Valuation in this niche tends to fluctuate more than in traditional fintech and is often shaped by investor sentiment, market cycles, and regulatory developments.
RegTech & Compliance
Startups in this niche help financial firms meet their compliance and security obligations. Offerings include identity verification (KYC), anti-money laundering (AML) tools, fraud detection systems, transaction monitoring, and regulatory reporting platforms.
These companies often sell into banks, fintechs, and payment processors, operating with SaaS or usage-based pricing. While they may not be as flashy as consumer-facing fintechs, strong retention and steady demand make this a consistently valuable category.
Capital Markets & Trading
Companies in this niche provide tools and infrastructure for investors, brokerages, and financial institutions. It includes retail trading apps, institutional trading software, market data platforms, and automated trading systems. Revenue comes from a mix of order flow, subscriptions, execution fees, or software licensing.
While retail trading platforms face pressure on margins, infrastructure providers with deep integration into capital markets workflows tend to enjoy higher valuation multiples and longer sales cycles.
SMB & Enterprise Fintech
Platforms that serve small businesses or enterprises with financial tools and services. Examples include expense management, payroll, accounting software, B2B payments, procurement platforms, and embedded finance solutions.
These companies often rely on recurring revenue from SaaS subscriptions or transaction-based fees. Growth may be slower than in consumer fintech, but retention is stronger and revenue tends to be more predictable. Investors generally value product stickiness and integration with business operations.

How Founders and Investors Apply These Multiples
Valuation benchmarks like these rarely sit in isolation. In practice, founders and investors use structured multiples to test fundraising narratives, evaluate strategic options, and align expectations across boards, acquirers, and capital providers.
At Finro, these datasets are integrated into broader valuation advisory engagements, financial models, and M&A positioning work. The objective is not only to reference market ranges, but to understand where a company fits within them — and how shifts in efficiency, growth, and product focus influence valuation outcomes.
Learn more about Finro’s valuation advisory work.
Related Fintech valuation research and market context
How Valuation Shifts by Round
Now that we’ve mapped fintech into nine key niches, the following sections break down how these valuation signals evolve across funding stages, starting with how multiples shift by round.
Across our 360-company dataset, valuations outgrow cumulative funding dramatically. From an average $7 million seed valuation to $1.08 billion by Series E+, valuations expand over 150x, while total capital raised grows by only 30–40x, highlighting how much investors pay for value creation versus deployed capital.
Digging into specific rounds reveals where those bumps happen:
Seed & Series A: Betting on Potential
Investors back vision over traction at the very start. Seed and Series A deals trade around 15x EV/Revenue despite raising only about $7 M (Seed) or $32 M (Series A). Cadeia’s Seed round closed at 25x before meaningful revenue, and Finteum’s fetched 9.3x on the strength of its distributed-ledger vision. In Series A, Trustly’s round came in at 8x after early merchant wins, while Flowpay scored 43.2x based on its embedded lending pilot—proof that early multiples hinge on team, market size, and roadmap.
Series B: Demand for Repeatability
Series B companies, which have raised about $84 M on average, see multiples dip to 12.3x as investors insist on clear product–market fit. Payhawk’s Series B at 11.4x reflected strong expense-management traction in Europe, and Buckzy commanded 11.7x after consistent remittance volume. More speculative plays like Gynger still closed at 37x on smaller rounds, underscoring how revenue predictability drives pricing at this stage.
Series C: Traction Translates to Value
Once growth is proven, valuations jump to 18.7x EV/Revenue on roughly $130 M in funding, pushing valuations from $84 M to $221 M. Parafin’s Series C at 21.1x rewarded its small-business credit platform’s steady adoption, while Upvest closed at 9.3x as it expanded its API custody offering. This stage delivers the single biggest uplift when concrete KPIs meet investor expectations.
Series D: Capital Efficiency Peaks
Multiples hold at 17.0x in Series D as companies raise about $221 M and secure valuations near $634 M. Qonto’s Series D at 19.1x reflected its rapid SME banking scale in Europe, and Brex achieved 24.6x by integrating corporate card and expense tools. This round shows how hitting revenue milestones without endless dilution earns premium pricing even pre-IPO.
Series E & Beyond: Fundamentals Rule
Valuations top $1 B by Series E+, with funding averages of $1.08 B, as investors dial multiples back to 16.1x and lean into fundamentals and public-market comparables. Melio’s Series E at 16.7x came after proving its B2B payments flywheel, while Checkout.com’s earlier 30.7x in Series D blends into a broader range—showing late-stage rounds balance growth ambitions with a clear path to profitability.
These examples illustrate the journey from speculative early-stage bets, through traction-driven uplifts, to efficiency-focused late-stage pricing. Next up are the core valuation methods — EV/Revenue, EV/EBITDA, and EV/Funding — so you can choose the right metric for your own benchmarks.

How Fintech Companies Are Valued
We’ve covered how valuations shift across funding rounds — now let’s unpack how those numbers are actually calculated.
There’s no single formula that fits every fintech startup. Depending on the stage, business model, and visibility into financials, investors lean on different valuation methods. Here are the three most common ones we’ve seen in our dataset:
EV/Revenue:
This is the go-to multiple for early- and mid-stage companies. It’s clean, easy to benchmark, and works well when profitability is still a few years out. Most of the companies in our database — especially those from Seed through Series C — were priced using EV/Revenue. Investors here are focused on topline growth, market size, and trajectory, even if margins aren’t fully optimized yet.
EV/EBITDA:
By the time a fintech company hits late Series D or E, profitability starts to matter — or at least, the path to it does. That’s where EV/EBITDA enters the picture. It’s more common in mature niches like SMB fintech, capital markets platforms, or insurtech companies that already generate cash. While fewer startups qualify here, those that do are often valued more like scaled financial services businesses than high-burn tech plays.
EV/Funding:
This one’s more niche — but helpful when revenue is either nonexistent or not meaningful yet. Think stealth-stage infrastructure plays, crypto wallets pre-launch, or compliance tools still in pilot. In these cases, we’ve seen M&A deals and some early rounds priced off multiples of total capital raised, usually ranging from 2x to 5x funding, depending on the perceived strategic value.
VC Pricing vs. M&A Outcomes
Another layer to consider is who’s doing the valuation. Venture capitalists tend to price on future potential: product roadmap, market timing, and long-term upside. Acquirers, on the other hand, price on what’s defensible — tech moat, customer lock-in, regulatory licenses, or cost synergies. That’s why you’ll often see higher revenue multiples in Series A/B rounds than in late-stage M&A transactions.
For example, a Series B raise at 20x revenue might not translate to a 20x exit. Buyers will look at what’s proven, not just what’s pitched.
In the next section, we’ll explore how these methods and pricing behaviors vary across fintech niches — because not all categories are valued the same. Payments don’t move like Crypto. Lending isn’t priced like RegTech. Let’s get into it.

What Niche You’re In Still Matters
So far, we’ve looked at valuation by round and how companies are priced. But there’s another layer that plays a big role: the niche you operate in. Across our 360-company dataset, valuation multiples varied widely depending on the type of fintech business, and the story those numbers tell is worth unpacking.
For example, Capital Markets & Trading companies posted some of the highest EV/Revenue multiples in our dataset, with a median of 18.3x. These platforms, often API-first and embedded deeply into client workflows, benefit from sticky revenue and strong scalability. Even at early stages, the defensibility and infrastructure-style positioning pushed valuations upward.
At the other end, Blockchain & Crypto companies averaged 9.4x, with a wider spread across rounds. Some early-stage crypto infra startups were priced aggressively on future use cases, but in later stages or M&A, many were pulled down by volatility, unclear regulatory footing, or shifting investor sentiment.
Lending & Credit startups — a category often judged by capital efficiency and risk modeling, saw median multiples around 10.6x. Notably, companies like Sunbit and GoodLeap showed strong performance in Series C+ rounds, but valuations still reflected the cautious lens through which lending businesses are often evaluated.
In contrast, SMB & Enterprise Fintech and RegTech & Compliance startups saw healthier, more stable multiples, often between 14x and 17x, due to strong B2B use cases, recurring revenue, and regulatory tailwinds. These categories tend to be less sexy but more dependable, which M&A buyers and later-stage investors clearly favor.
Even within Payments & Transfers, one of the most crowded segments, valuations ranged from sub-10x for wallet and remittance startups to 25x+ for companies with embedded payment rails or vertical integrations. The takeaway here: not all payments are created equal — infrastructure earns more than consumer-facing layers.
These differences don’t just reflect investor preferences. They signal what the market values: predictability, infrastructure, compliance advantages, and use-case defensibility.
Next up, we’ll break down these findings and explain how you can explore them deeper or benchmark your own startup using the full dataset.

Dig Deeper: Explore the Full Dataset
This article only scratches the surface. If you’re fundraising, benchmarking competitors, pricing an investment, or just trying to make sense of where your fintech startup stands, the full dataset does the heavy lifting for you.
Our mid-year 2025 fintech valuation database includes:
360 companies across 9 fintech niches
Public, private, and M&A transactions
EV/Revenue, EV/EBITDA, EV/Funding multiples
Round-by-round breakdowns from Seed to Series F+
Key metrics like funding raised, valuation, business model, and niche tag
It’s designed to be actionable, whether you’re building a board deck, sizing a market, or pressure-testing comps before your next investor meeting.
If you found this helpful analysis, you’ll get even more out of the spreadsheet.
It’s available to download for €79.90, updated semi-annually, and instantly accessible.
👉 Click here to download the full Fintech Valuation Database
Key Takeaways
1. Valuations Outpace Funding Dramatically: Fintech valuations grow over 150× from Seed to Series E+, while funding rises just 30–40× across stages.
2. Multiples Peak at Series A–C: Valuation multiples often reach their highest between Series A and C, then normalize as traction replaces narrative.
3. Niche Still Drives Pricing: Blockchain, Lending, and SMB Fintech command premium multiples; Payments and Neobanks trade lower due to commoditization or competition.
4. Method Matters by Stage: EV/Revenue dominates early rounds, EV/EBITDA fits mature startups, while EV/Funding works for low-revenue or stealth-stage companies.
5. Comps Align with Strategy: Use comps to benchmark deals, back up investor narratives, or validate acquisition targets — but context is everything.
Answers to The Most Asked Questions
-
Across our 2025 dataset, fintech startups average 12.3x EV/Revenue, with significant variation by funding round and niche, from under 6x to over 40x.
-
Valuations typically peak at Series A–C, then normalize. Seed rounds price vision, mid-stages reward traction, and late stages focus on fundamentals like revenue efficiency.
-
Blockchain & Crypto leads with the highest median multiple, followed by Lending and SMB-focused fintech, driven by growth potential, market size, and competitive edge.
-
EV/Revenue is most common in early stages. Later-stage or profitable companies use EV/EBITDA. EV/Funding works for stealth or low-revenue fintechs still proving their model.
-
Yes. M&A deals often price lower than VC rounds, as acquirers prioritize defensibility, synergies, and financial metrics, not just potential or narrative.