

Proptech Valuation Multiples: 2025 Mid-Year Market Benchmarks
Founder of Finro Financial Consulting. Personally leads every valuation, modeling, and M&A advisory engagement.
View Lior's profile →Startup valuation, financial modeling, and M&A advisory for AI, fintech, and SaaS companies. Serving funded tech startups from pre-seed through pre-IPO.
About Finro →This analysis draws on Finro’s Proptech valuation database covering public companies, private startups, and M&A transactions across vertical SaaS, marketplaces, and infrastructure layers within real estate technology.
The Proptech market isn’t heading in one clear direction anymore. Some companies are still raising at high double-digit revenue multiples, while others, especially later-stage or ops-heavy models, are seeing valuations level off or even drop. Similar dispersion patterns are visible in AI valuation multiples, where pricing increasingly separates based on revenue durability and stack positioning.
We reviewed data from 216 PropTech companies across 9 categories, including public companies, private startups, and M&A transactions. What came out is a sharper picture of where investors still see upside—and where expectations are being reset.
This article highlights the patterns we found. It doesn’t cover every number or company (that’s in the downloadable dataset), but it should give you a solid read on where valuations are going and what might shape the second half of the year
PropTech Valuation Database and Benchmarks (Mid-2025)
This analysis highlights selected insights from Finro’s broader PropTech valuation dataset, which tracks public market benchmarks, private funding rounds, and M&A transactions across multiple PropTech niches.
The full dataset includes company-level comps, revenue multiples, transaction benchmarks, and segmentation across categories such as property management software, marketplaces, construction tech, data platforms, and operational infrastructure.
PropTech valuations in mid‑2025 show a widening gap between private optimism and public market discipline, with private companies averaging far higher revenue multiples than their public and M&A counterparts. Series C remains the sweet spot for pricing, where proven traction meets growth potential, while early rounds still benefit from narrative‑driven optimism and later stages face increased scrutiny.
AI‑driven platforms, sustainable solutions, and property investment marketplaces command the highest multiples due to their scalability and defensibility, while service‑heavy categories like home improvement and traditional management tools lag behind. These trends highlight how stage, niche, and ownership type shape valuations across the PropTech landscape.
- How We Broke Down the PropTech Landscape
- How founders and investors apply these multiples?
- Related vertical SaaS and platform valuation research
- Stage Matters: Series C Is Still Where the Magic Happens
- Some Categories Command a Premium. Others Don’t.
- Private vs. Public vs. M&A: A Valuation Gap That Speaks Volumes
- Want to Dive Deeper?
- Final Thoughts: PropTech Valuations Are Evolving
- Key Takeaways
- Answers to The Most Asked Questions
How We Broke Down the PropTech Landscape
PropTech is a broad label. It covers any company using technology to rethink how real estate is bought, sold, built, financed, rented, managed, or maintained. It includes SaaS platforms, AI tools, hardware integrations, marketplaces, and everything in between.
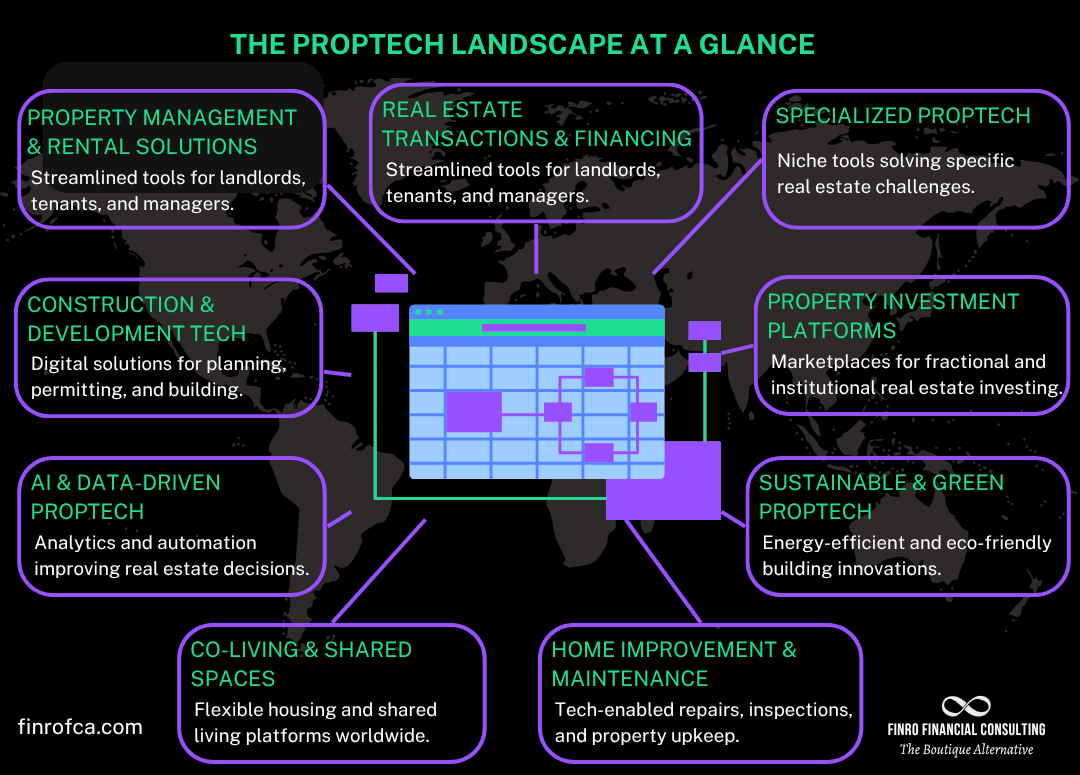
And since not all PropTech is built (or valued) the same way, grouping them properly matters. We organized the 216 companies in our dataset into nine categories, each reflecting a distinct part of the real estate lifecycle and a different investment story.
Here’s how we defined them:
1. Property Management & Rental Solutions
These companies streamline operations for landlords, property managers, and tenants—everything from rent collection and maintenance to smart locks and digital onboarding.
Examples:
Visitt – A tenant experience platform for multifamily buildings
AppFolio – End-to-end property management software
Homebot – Personalized home finance dashboards for owners and renters
Why it matters: These are often sticky, recurring-revenue platforms—but can be weighed down by lower margins or slower adoption cycles in legacy real estate environments.
2. Real Estate Transactions & Financing
Startups in this group simplify buying, selling, financing, and closing. Many replace manual, fragmented processes with digital workflows and embedded lending.
Examples:
Flyhomes – A platform offering cash-backed home buying
Doma – Digital title, escrow, and closing services
Stavvy – eClosing tools for mortgage and real estate professionals
Why it matters: Strong transaction volume and defensible workflows can drive solid revenue, but growth often hinges on market cycles.
For PropTech models tied to transaction flows or embedded finance, the mid-2025 fintech valuation benchmarks provide useful reference points for how the market prices distribution risk.
3. Construction & Development Tech
This category includes tools that digitize planning, permitting, on-site execution, and asset tracking. It ranges from BIM (building information modeling) to drone inspections and prefab coordination.
Examples:
BuildOps – Operations software for specialty contractors
Bridgit – Workforce intelligence tools for construction teams
BeamUP – AI-powered building design and operations planning
Why it matters: While adoption can be slow, these tools often go deep in enterprise workflows—unlocking significant value and long-term contracts.
4. AI & Data-Driven PropTech
These companies use AI, ML, or advanced analytics to price assets, analyze risks, forecast value, or drive automation. Often horizontal in nature, they sit across the real estate value chain.
Examples:
Cherre – A real estate data integration platform
Brightmerge – AI tools for real estate energy and utility modeling
PriceHubble – Property valuation and market insights using big data
Why it matters: Often capital-efficient and high-margin, this category attracts strong multiples—especially when products are API-first or embedded in workflows.

How founders and investors apply these multiples?
Valuation benchmarks like these rarely exist in isolation. In practice, founders and investors use structured multiples to test fundraising narratives, evaluate strategic positioning, and align expectations across boards, acquirers, and capital providers.
At Finro, these datasets are typically integrated into broader valuation advisory engagements, financial models, and M&A positioning work. The objective is not only to reference market ranges, but to understand where a company fits within them — and how shifts in efficiency, distribution, and product focus influence valuation outcomes.
Related vertical SaaS and platform valuation research
PropTech valuation trends increasingly align with broader vertical SaaS and platform ecosystems, where distribution leverage, integration depth, and recurring revenue durability influence how investors price growth across adjacent sectors.
5. Co-Living & Shared Spaces
Platforms that focus on short-term rentals, furnished living, digital nomad housing, and shared accommodation. Many operate hybrid models: part real estate, part tech, part service.
Examples:
Blueground – Furnished apartment rentals for mid- to long-term stays
Habyt – Global co-living provider with an emphasis on flexibility
Tabas – Latin American operator blending hospitality and PropTech
Why it matters: High multiples reflect growth potential and global trends—but the asset-heavy or hybrid nature often comes with operational complexity.
6. Home Improvement & Maintenance
Tech that supports repairs, inspections, renovations, and ongoing maintenance. Often focused on workflow optimization or marketplace matching.
Examples:
Lessen – End-to-end property services management
Allreno – Home improvement planning and contractor management
RoboDeck – Automated deck cleaning and maintenance system
Why it matters: While less glamorous, these companies often build sticky relationships with landlords or HOAs—but can be hit-or-miss on scalability.
7. Sustainable & Green PropTech
Solutions designed to reduce emissions, improve energy efficiency, and support ESG goals. Includes smart building materials, energy modeling, and carbon tracking.
Examples:
Brightmerge – Utility optimization using AI
Verdigris – Real-time energy usage tracking for commercial buildings
BeamUP – Also overlaps here, with a focus on sustainability insights
Why it matters: Regulatory tailwinds and investor ESG mandates help—though revenue models and timelines can vary widely.
8. Property Investment Platforms
Platforms that let individuals or institutions invest in real estate—sometimes with fractional ownership, tokenization, or syndication tools.
Examples:
Roofstock – Buy-and-hold single-family rental investments
Homeward – Helps buyers purchase before selling
Propseller – Digitized agency services with investment tools baked in
Why it matters: These models benefit from strong transaction fees and customer stickiness—but they’re exposed to market cycles and regulation.
9. Specialized PropTech
Tools that didn’t fit neatly elsewhere—focused on niche parts of the real estate stack. Often point solutions solving highly specific problems.
Examples:
Snapdocs – Mortgage notarization and e-signing
Obligo – Security deposit alternatives
Peek – Virtual tours and property marketing
Why it matters: These companies can grow quickly in their niche, but may struggle to scale or justify high revenue multiples unless they expand scope.
Each category represents a different logic for valuation—whether it’s recurring SaaS, volume-based fees, capital-light AI layers, or operational revenue. That’s why we structured the dataset this way. It helps explain why some categories pull high multiples, while others get priced more conservatively.
With the categories in place, let’s look at how valuation multiples actually compare—and which parts of PropTech are still getting investor love.
Stage Matters: Series C Is Still Where the Magic Happens
Now that we’ve set the stage for what PropTech includes, let’s look at how funding rounds shape valuations.
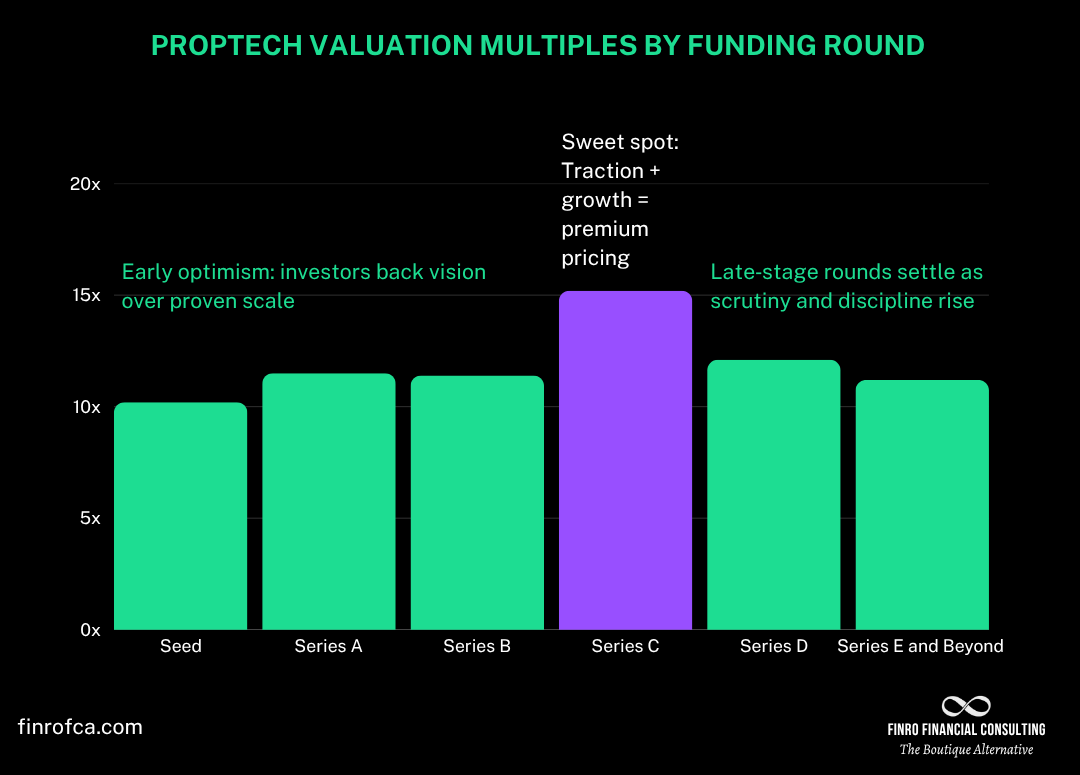
One clear takeaway: Series C is where valuations peak.
In our dataset, Series C companies trade at an average of 15.2x revenue, the highest across all rounds.
These are typically businesses that have found product‑market fit, scaled their operations, and are moving past vision-selling into repeatable, defensible growth.
They’ve proven enough to attract premium pricing—without the late‑stage pressure that comes with chasing profitability at scale.
Beyond Series C, multiples start to normalize. Series D companies averaged 12.1x, and by Series E+ we saw a further dip to around 11.2x.
Early‑stage companies, meanwhile, still command strong multiples relative to their size, often on the strength of narrative and market potential rather than financial maturity.
And that same pattern shows up when you compare different types of PropTech companies. Some niches still command premium pricing regardless of stage, while others struggle to break into double‑digit multiples.
That’s where we go next—looking at which categories are winning the valuation game and which are quietly undervalued.
Some Categories Command a Premium. Others Don’t.
Now that we’ve looked at how stage affects valuations, let’s shift to where those valuations are actually landing across PropTech categories.
Some niches are still commanding premium pricing.
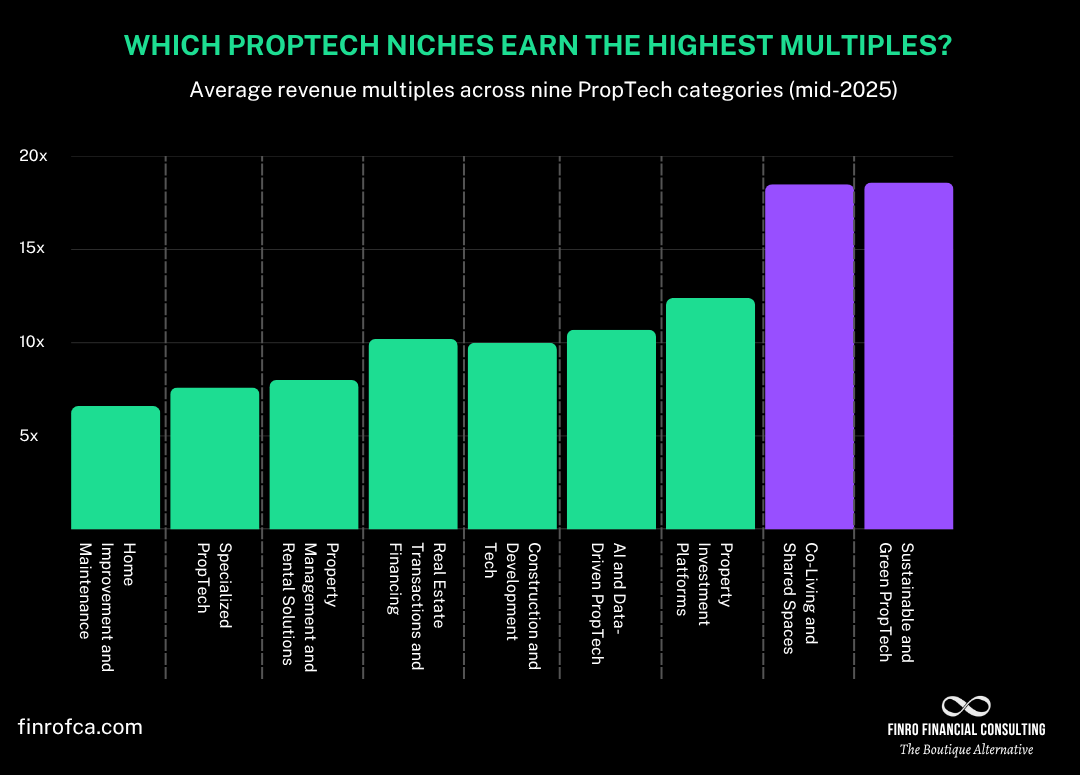
AI and data-driven platforms sit near the top of the list, trading at around 11x revenue, supported by their scalability, recurring revenue models, and the growing demand for predictive insights.
Property investment platforms also post strong numbers, with multiples averaging above 12x, likely a reflection of their ability to monetize transactions while staying relatively capital-light.
At the other end, categories like home improvement and maintenance and traditional property management solutions continue to trail, both averaging single-digit multiples.
These are solid, often sticky businesses, but their slower growth profiles and more operational-heavy models hold back valuations. Construction tech sits in the middle—its adoption curve can be slow, but the long-term enterprise contracts give it a steady, if not flashy, pricing position.
This spread isn’t surprising. Valuations tend to reward models that are scalable, tech-led, and defensible, while penalizing those that are service-heavy or tied closely to real estate cycles. The same infrastructure premium shows up in API-as-a-Service valuation benchmarks, where integration depth and usage monetization drive pricing
Next, we’ll look at another layer of this story: the gap between private, public, and M&A valuations—and what that says about how different buyers are pricing risk.
Private vs. Public vs. M&A: A Valuation Gap That Speaks Volumes
We’ve seen how stage and category drive valuations. But another layer stands out: who owns the company?
Private PropTech startups continue to command a clear premium, with average revenue multiples of around 15.6x.
Public companies, by comparison, trade at just over 7x, reflecting the harsher scrutiny of public markets and the pressure of quarterly performance.
And when it comes to M&A, the numbers drop further, averaging just over 8x, as buyers prioritize cash flow, defensibility, and integration over lofty growth narratives.
This gap tells a familiar story. Private investors are still pricing for potential. Public markets and acquirers are paying for proof. For founders, that means knowing which valuation yardstick you’ll be measured against is just as important as hitting your growth targets.
This gap tells a familiar story.
Private investors are still pricing for potential.
Public markets and acquirers are paying for proof.
For founders and investors alike, knowing which yardstick you’ll be measured against is just as important as hitting growth targets.
If you want to go deeper with category‑by‑category breakdowns, funding averages, and full valuation data for 216 companies, we’ve compiled everything into a downloadable dataset. Here’s how you can get it.

Want to Dive Deeper?
What you’ve seen here is just the surface.
Our full dataset covers 216 PropTech companies, spanning public firms, private startups, and recent M&A deals across nine carefully defined categories. It includes:
Valuation data: Enterprise value, revenue, and calculated multiples
Funding insights: Capital raised by stage and category
Market segmentation: Breakdowns by niche, stage, and ownership type
The dataset also provides company‑level entries, averages by niche and stage, and ready‑to‑use figures, making it a practical tool for analysis, presentations, or benchmarking.
→ Download the full dataset for €79.90
A straightforward resource for founders, investors, and analysts who want the numbers behind the insights.
Final Thoughts: PropTech Valuations Are Evolving
PropTech isn’t cooling off — it’s recalibrating. Investors are rewarding companies that prove they can scale efficiently, automate intelligently, and build defensible revenue models.
At the same time, the gap between private market optimism and public market discipline is growing, with M&A pricing adding yet another reality check.
For founders, this means understanding where your company fits — by stage, category, and market perception — has never been more critical. For investors and acquirers, it’s about knowing where value is justified and where it’s simply been assumed.
The data tells the story: PropTech is still full of opportunity, but the bar is higher than ever.
Key Takeawys
1. Series C Commands the Peak: Series C companies achieve the highest multiples, reflecting proven traction and growth without late‑stage profitability pressures.
2. Private Markets Pay More: Private PropTech valuations significantly outpace public and M&A pricing, highlighting investor optimism versus market and acquirer discipline.
3. AI and Investment Platforms Lead: AI‑driven PropTech and property investment platforms command top multiples due to scalability, defensibility, and capital‑light models.
4. Service‑Heavy Niches Lag Behind: Home improvement, maintenance, and traditional property management trail, reflecting slower growth and operational intensity.
5. The Bar Is Rising: Investors demand efficiency, defensible models, and revenue quality — making smart positioning essential for future PropTech success.
Answers to The Most Asked Questions
-
PropTech refers to technologies transforming real estate — from digital property transactions and AI analytics to construction software, smart buildings, and investment platforms.
-
They’re typically valued using revenue multiples, factoring in growth potential, scalability, market positioning, and defensibility, with adjustments for stage, niche, and ownership type.
-
AI‑driven platforms, sustainable PropTech, and property investment marketplaces command the highest revenue multiples due to scalability, defensibility, and strong investor demand.
-
Private investors often price growth potential and market narratives, while public markets and acquirers value proven performance, profitability, and integration readiness.
-
We reviewed 216 PropTech companies across nine categories, covering public firms, private startups, and recent M&A transactions, with detailed funding and valuation data.

AI Agents Valuation Multiples: Mid-2025 Update
