AI Valuation Multiples: Q4 2025 Update
Founder of Finro Financial Consulting. Personally leads every valuation, modeling, and M&A advisory engagement.
View Lior's profile →Startup valuation, financial modeling, and M&A advisory for AI, fintech, and SaaS companies. Serving funded tech startups from pre-seed through pre-IPO.
About Finro →AI valuations held up through the final quarter of 2025, but the picture is uneven.
Pricing remains highest where companies control core models or the rails that power them, while applied categories track closer to familiar software benchmarks. Investors are still active, although the bar for quality and defensibility has risen.
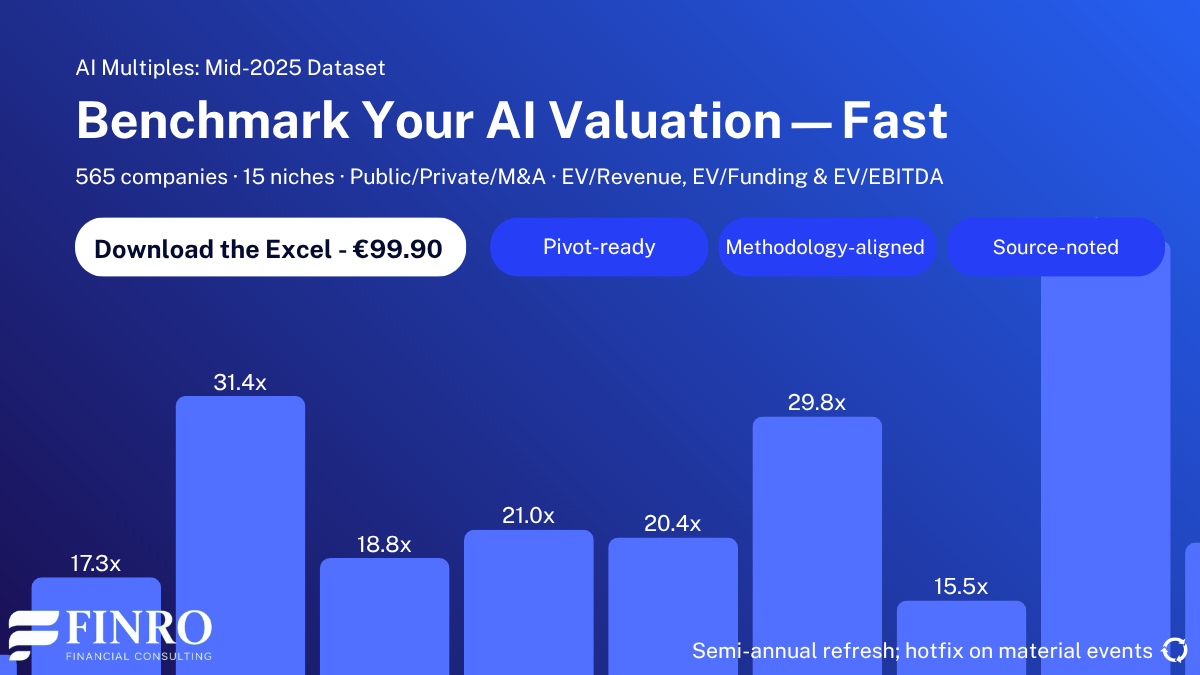
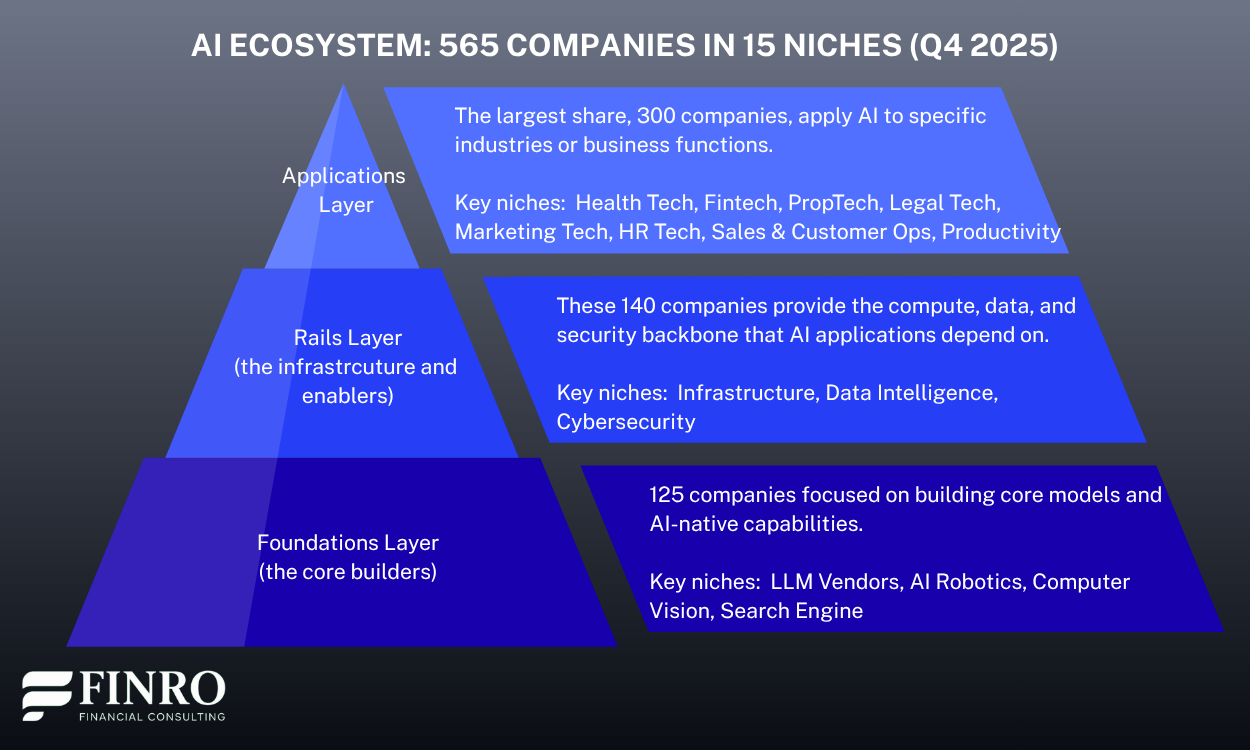
This update looks at 565 companies across fifteen niches. The set spans public names, venture-backed startups, and M&A that helps anchor multiples at each stage.
By separating model builders, infrastructure, data platforms, and industry verticals, the analysis shows where premiums persist and where they are normalizing.
What follows is a high-level read on pricing and activity. Readers who want company-level context, additional data, and side-by-side benchmarks by niche and stage can download the full dataset for €99.90.
TL;DR
Scope and Methodology
This update looks at 565 AI companies active through Q4 2025. The common denominator is that AI is central to the product or moat.
That includes public names with disclosed metrics, venture-backed startups with reported rounds, and acquisitions where deal terms help anchor pricing.
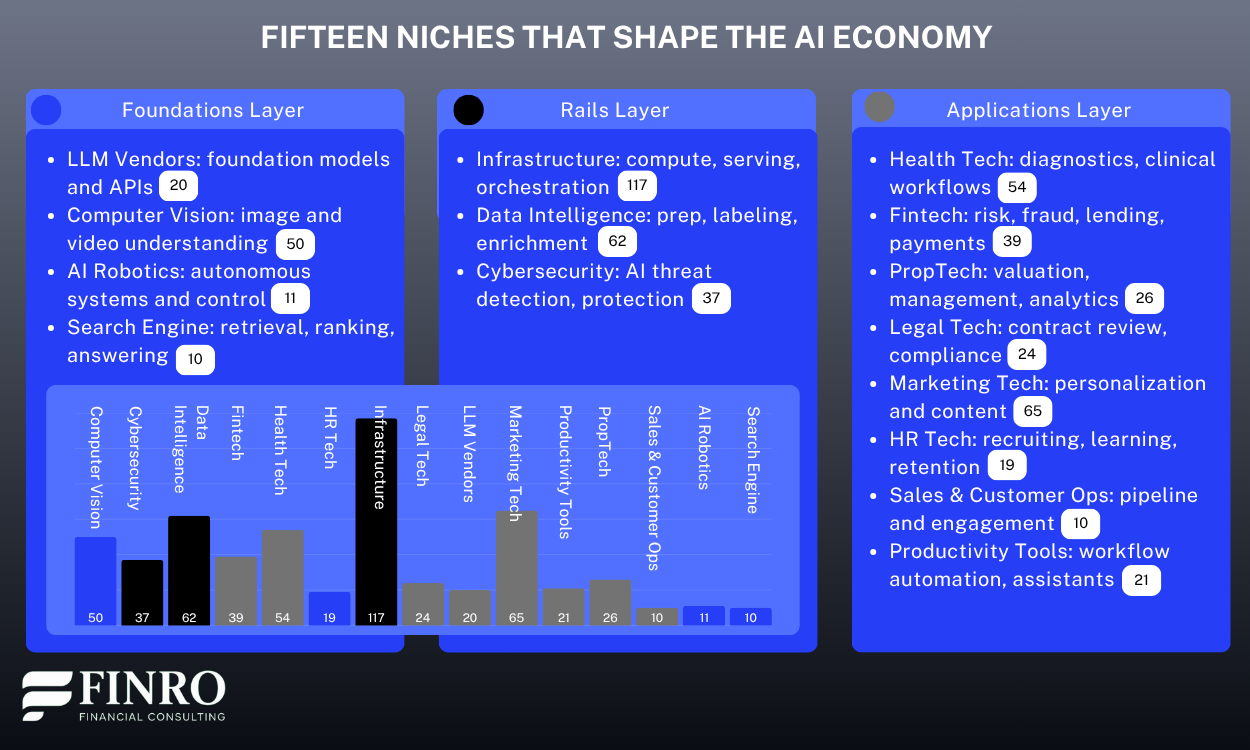
The analysis uses fifteen niches that mirror how investors actually underwrite AI today rather than a generic “AI vs. non-AI” split. Model builders sit in LLM Vendors. The rails they run on sit in Infrastructure.
Data-centric platforms and tools that turn data into decisions sit in Data Intelligence. On the applied side, we separate verticals where adoption patterns, pricing power, and buyer behavior diverge, which is why Health Tech, Fintech, Legal Tech, PropTech, Marketing Tech, HR Tech, and Sales & Customer Ops each get their own lane.
We also track capability-driven niches such as Computer Vision, AI Robotics, Cybersecurity, Productivity Tools, and Search Engine. Keeping these buckets distinct lets us compare like for like and avoids averaging away real differences between a hospital workflow tool and a commercial real estate platform.
Company records include valuation, funding raised, and where available revenue and EBITDA. For public companies we rely on market data and filings. For private companies we use reported post-money valuations and disclosed round sizes.
For M&A we use enterprise value at announcement when available. Revenue is taken as the most recent disclosed annual figure or trailing twelve months when that is cited. All values are in USD for consistency.
Classification favors the core economic engine. If AI is an add-on to a conventional product, it does not qualify. If AI is the driver of accuracy, automation, or experience and is central to how the company competes, it does.
LLM ecosystem tooling is placed with the closest economic layer. As examples, model serving, vector databases, and inference orchestration are in Infrastructure, while evaluation and agent frameworks are kept with LLM Vendors if their usage and revenue are tied to the model layer.
The summary views show averages to make cross-niche comparisons straightforward. We monitor outliers for data quality but do not remove them solely for being large. When data is missing, the record remains in the set but is excluded from the specific calculation that requires the missing field.
Market Overview
The picture that emerges from this quarter’s dataset is one of contrasts. Certain niches continue to trade at premium levels, while others are gradually moving closer to software benchmarks that feel more familiar to investors.
The spread reflects not just differences in revenue quality, but also how investors perceive defensibility and long-term upside across the ecosystem.
The classification into fifteen niches allows us to make these comparisons more meaningful.
At the foundation of the market sit the companies building models and AI-native capabilities. These include LLM vendors, robotics players, computer vision platforms, and AI-driven search engines.
Above them are the infrastructure providers, which supply compute, data, and security. This group spans pure infrastructure companies, data intelligence platforms, and cybersecurity specialists.
Finally, the applied layer captures how AI reaches end users in specific verticals. Health tech, fintech, proptech, and legal tech each reflect the adoption curve of their industries, while marketing tech, HR tech, sales and customer operations, and productivity tools represent functional applications that cut across sectors.
Keeping these layers separate avoids averaging away meaningful differences. LLM vendors and infrastructure companies, for example, are valued for their position in the stack and their ability to shape the direction of the field, while applied categories are priced more like SaaS, with emphasis on sales cycles and customer stickiness.
Looking at the dataset through this lens shows both where investors are still paying a premium and where expectations are starting to normalize.
Highlights by Niche
The previous sections outlined how we structured the dataset and why the fifteen niches matter. With that framing in place, we can now look at what stands out when valuations are compared side by side.
The goal here is not to provide exhaustive numbers, but to highlight where investor sentiment and multiples are diverging across the ecosystem.
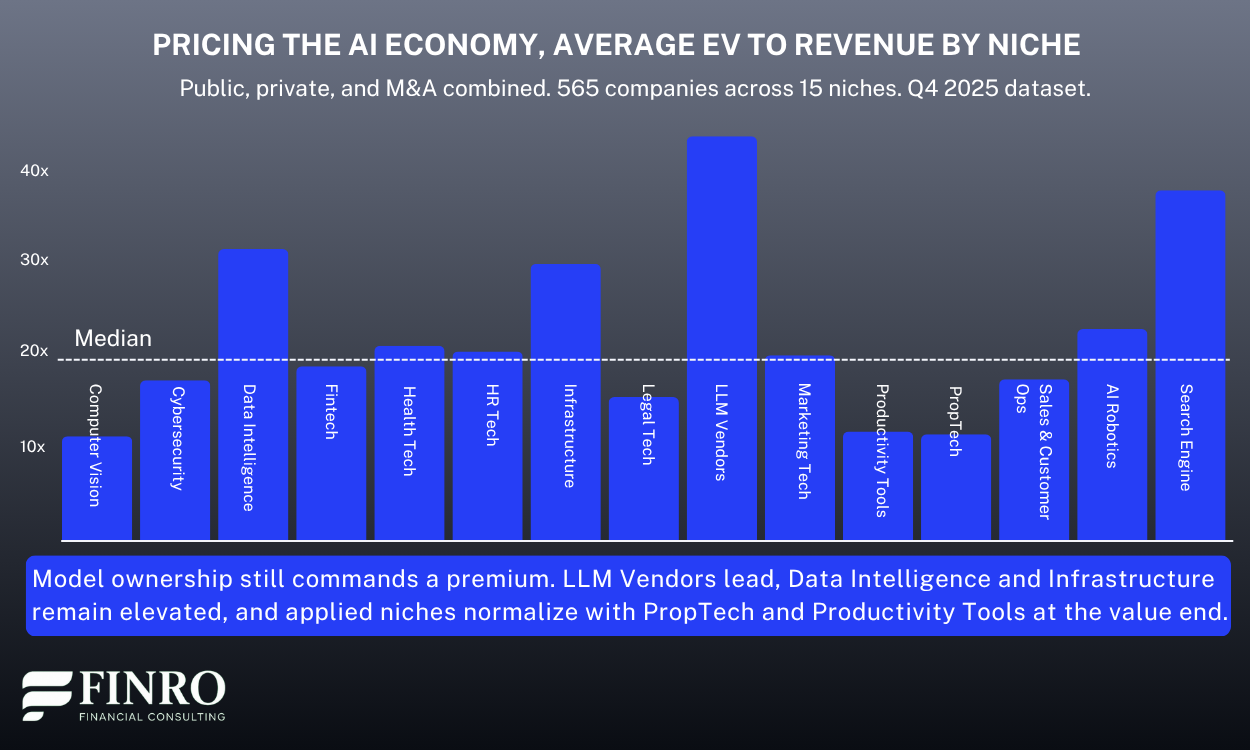
One clear takeaway is that LLM Vendors continue to dominate. Their multiples remain the highest in the dataset, a reminder that investors still see ownership of the model layer as uniquely defensible.
Data Intelligence also shows unexpectedly strong multiples. Tools that clean, label, and enrich data may seem less glamorous than frontier model labs, but the pricing signals confirm their role as indispensable enablers.
At the same time, some niches are cooling. Productivity Tools surged in early 2024 but are now trading at more rational levels as investor attention shifts toward differentiation and retention rather than raw adoption.
Similarly, PropTech and Legal Tech show more normalized benchmarks, reflecting slower adoption in industries where decision cycles are measured in years rather than months.
A surprise on the upside comes from Health Tech, where multiples remain elevated despite broader market caution. Investor confidence in clinical AI use cases and efficiency gains in healthcare workflows is clearly holding firm.
On the other end of the spectrum, Cybersecurity companies, while essential, are priced closer to established SaaS norms, showing that not every “AI-enabled” label automatically commands a premium.
Together these trends underline why separating the dataset into niches matters. Averaging across AI would hide the fact that some categories, like LLM Vendors or Data Intelligence, trade at a clear premium, while others are being pulled back toward more traditional software benchmarks.
Round-Level Insights
The niche analysis shows how valuations differ across industries and business models. Looking at the same dataset through the lens of funding rounds tells a complementary story: how investor expectations evolve as companies mature.
At the earliest stages, Seed valuations stand out as ambitious relative to revenue. Multiples here are often less about financial performance and more about potential, with investors betting on team and technology before traction. Series Abuilds on that momentum. Valuations grow quickly, often outpacing revenue, as companies raise larger rounds to prove scalability.
The picture shifts as companies move into Series B and C. Valuations expand further, but capital requirements grow even faster. These are the rounds where investors expect clear go-to-market execution, product maturity, and early signals of efficiency. The spread in multiples also widens, reflecting how unevenly companies manage the transition from experimentation to scale.
By Series D and beyond, revenue bases are larger and multiples naturally compress. Investors give credit for scale, but they also demand evidence of sustainable economics and a credible path to profitability. At this stage, strategic positioning and potential exit routes weigh more heavily than raw growth.
What stands out in this dataset is the contrast between the optimism of early-stage funding and the discipline of later stages. Seed and Series A multiples remain stretched, while companies in Series D and beyond trade at far more measured levels. It is a reminder that the AI market continues to reward bold bets early on, but the closer companies get to exit, the more they are judged like any other mature technology business.

Download the Full Dataset
The snapshots above are meant to orient you. The dataset goes deeper. It covers 565 AI companies across 15 niches with company-level valuation, revenue, and funding fields, grouped by public, private, and M&A, and organized by stage so you can cut the market the same way investors do.
Inside you will find consistent multiples for cross-niche comparisons, round-by-round benchmarks, and summary views you can drop straight into a deck. It is useful for board materials, fundraising prep, competitive scans, and valuation sanity checks. Each record follows the same structure, which makes filtering and pivoting fast.
The file is delivered in Excel with the same tabs used in this article, including Summary by Niche, Summary by Round, and the full company table. Notes on classification and data sources are included so you can see how each entry was built and where estimates were required. The dataset is refreshed quarterly.
The complete dataset is available for €99.90. If you work with AI companies or invest in them, this gives you a clean, comparable view of how the market is pricing the space today.
Summary
AI valuations closed 2025 on a mixed note. Premiums remain concentrated around model builders and data enablers, while many applied niches are moving closer to software benchmarks.
Round-level trends highlight the same contrast: early-stage optimism pushes Seed and Series A multiples high relative to revenue, while later stages show natural compression as companies scale.
Separating the dataset into fifteen niches and funding stages makes these differences visible. Without that structure, the market can look like a single story, when in reality valuation dynamics diverge sharply depending on where a company sits in the stack and how far along it is in its journey.
For founders and investors alike, the takeaway is clear: the AI market still rewards bold bets at the frontier, but discipline is returning as companies mature. Understanding where your business fits in this landscape is as important as the headline multiple itself.

Key Takeaways
LLM vendors lead: LLM vendors command the highest multiples, reflecting defensibility, data moats, and strategic weight of controlling core models and capabilities today.
Rails remain strong: Infrastructure and data intelligence sustain strong pricing as compute, orchestration, and data quality remain essential enablers for training, deployment, compliance.
Applied niches normalize: Applied niches trend toward SaaS benchmarks, with fintech resilient, while proptech, legal, HR, and productivity normalize as adoption steadies broadly.
Round dynamics diverge: Seed and Series A multiples remain stretched on potential, while later stages compress as scale, efficiency, and profitability increasingly matter.
Structure reveals dispersion: A fifteen-niche taxonomy and layered framing reveal meaningful valuation dispersion, enabling like-for-like comparisons that simple market averages would obscure entirely.
Answers to The Most Asked Questions
-
AI valuation multiples remain highest for LLM vendors and infrastructure, while applied niches like PropTech and HR Tech trade closer to SaaS benchmarks.
-
LLM vendors lead with the strongest multiples, followed by data intelligence and infrastructure, reflecting defensibility and strategic weight in the AI stack.
-
Seed and Series A valuations appear high relative to revenue, while later rounds show natural multiple compression as companies scale revenue and efficiency.
-
Yes, applied categories including PropTech, Legal Tech, HR Tech, and Productivity Tools often trade closer to enterprise SaaS benchmarks than frontier AI layers.
-
The dataset covers 565 AI companies across 15 niches, including public firms, private startups, and M&A transactions, refreshed quarterly for updated valuations.