
AI Valuation Multiples Database: Q1 2026 Update
AI Valuation Multiples Database: Q1 2026 Update
575 AI companies. 15 niches. Public comps, private rounds, and M&A transactions. Structured for the valuation conversations that actually matter.
Who this is for
This dataset is the right fit if you are preparing a fundraising round and need defensible comps, benchmarking an AI deal for an IC memo, building a financial model with real market data, or advising on an AI acquisition and need to understand how niche and revenue model affect pricing.
What is inside
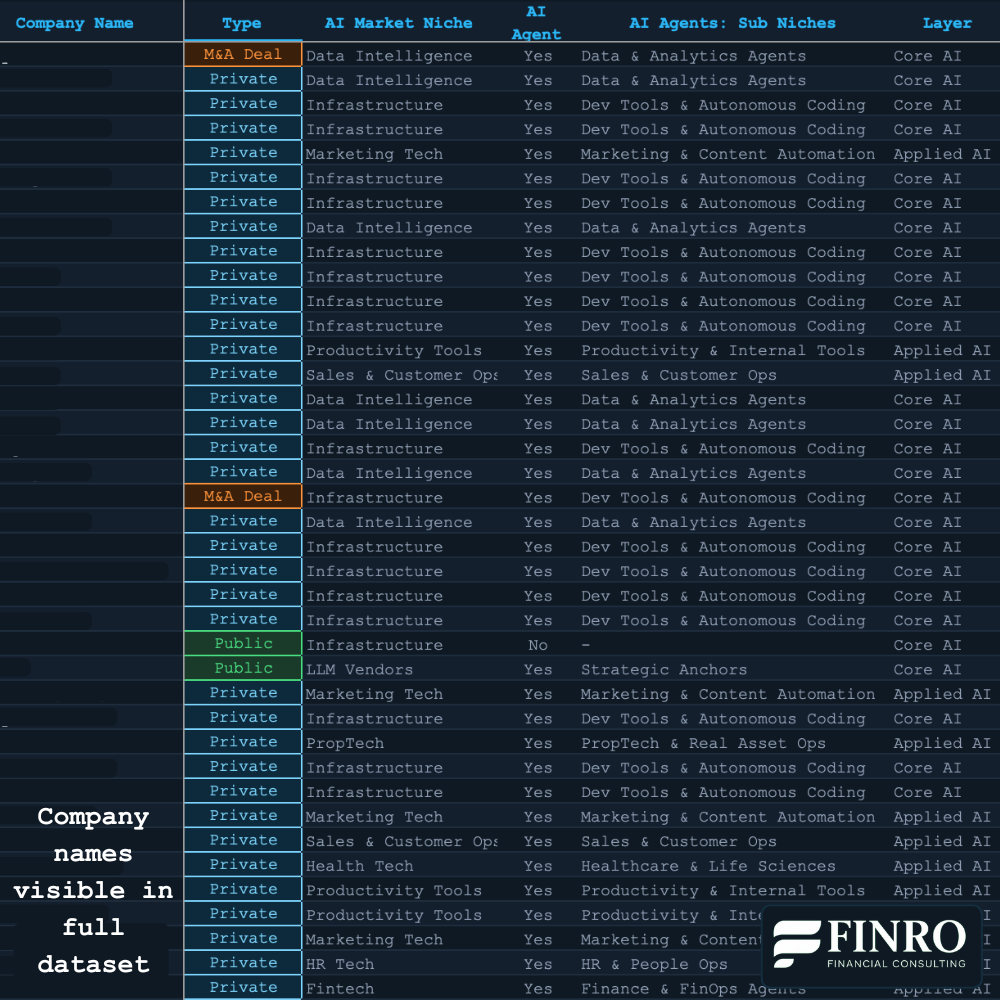
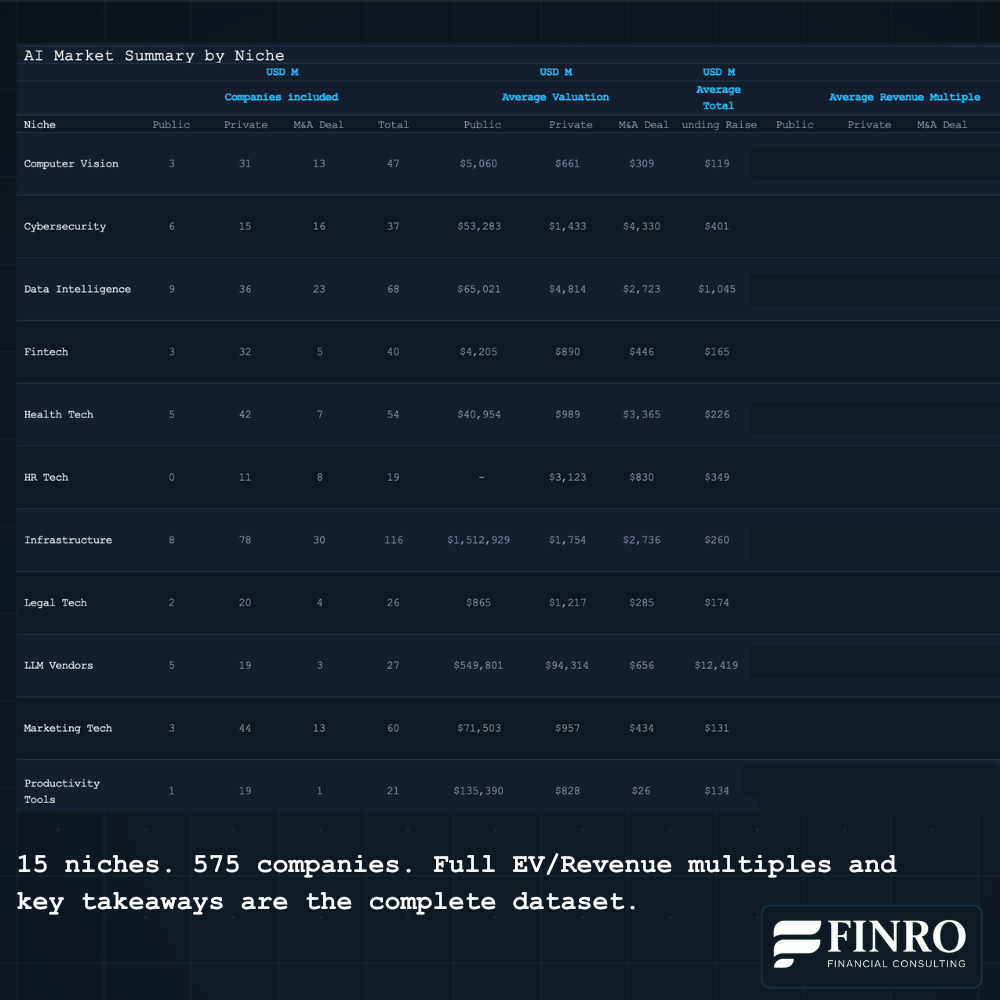
575 companies across 15 AI niches. Computer Vision, Cybersecurity, Data Intelligence, Fintech, Health Tech, HR Tech, Infrastructure, Legal Tech, LLM Vendors, Marketing Tech, Productivity Tools, PropTech, Sales and Customer Ops, AI Robotics, and Search Engine. Each niche is independently tagged so you can filter to the subset that actually resembles your company.
Three company types in one database. Public comps, private startup transactions, and M&A deals in a single structured file. Seed through Series J and beyond, across 409 private companies and 47 public comps.
Dedicated analysis by AI category. The database includes separate analytical breakdowns for Agentic AI, Core AI, and Applied AI. Each category reflects a different valuation logic: infrastructure and platform potential for Core AI, execution and retention metrics for Applied AI, and autonomy and tool-use depth for Agentic AI. This structure lets you compare against companies that actually operate under similar conditions, not just similar buzzwords.
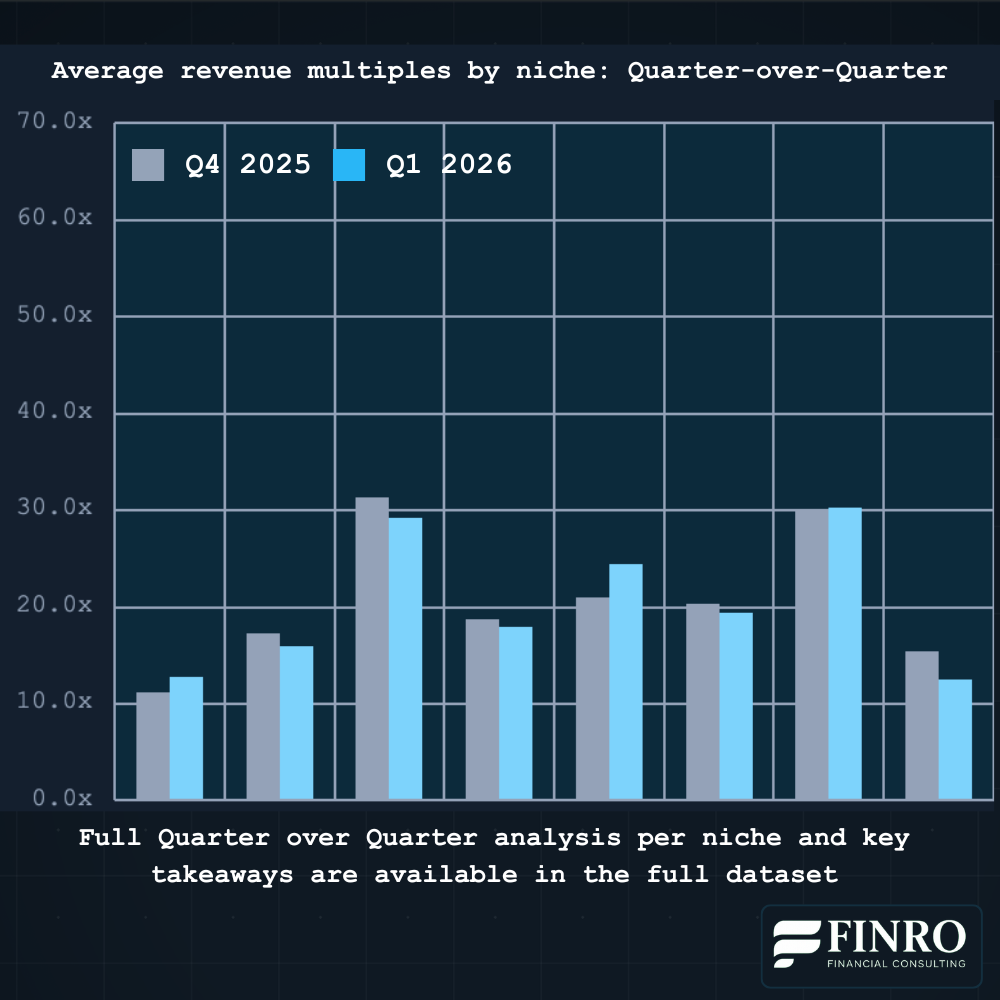
Quarter-over-quarter multiple comparison by niche. Every niche includes a Q4 2025 to Q1 2026 comparison across public, private, and M&A deal types. You can see how multiples are moving, not just where they sit today. LLM Vendors, for example, moved from 43.5x to 65.2x average EV/Revenue between quarters. Infrastructure held steady around 30x. Those differences matter when building a positioning narrative.
Fields that support real valuation work. EV, revenue, EBITDA where available, funding raised, implied multiples (EV/Revenue, EV/EBITDA, EV/Funding), and structured notes that explain the context behind each data point.
How teams use it
Teams typically use this dataset to benchmark valuation ranges before a fundraising process, build comparable sets for IC memos and investor updates, pressure-test revenue multiple assumptions inside financial models, and understand how niche and stage positioning affect pricing across the AI market.
The goal is not to produce a single headline multiple. It is to understand where your company sits within the broader AI market structure, and to communicate that clearly to investors.
What makes this different
Most AI multiples you find online are averages that mix infrastructure companies with vertical SaaS, early-stage bets with mature platforms, and funding rounds with revenue-generating businesses, then report a single number.
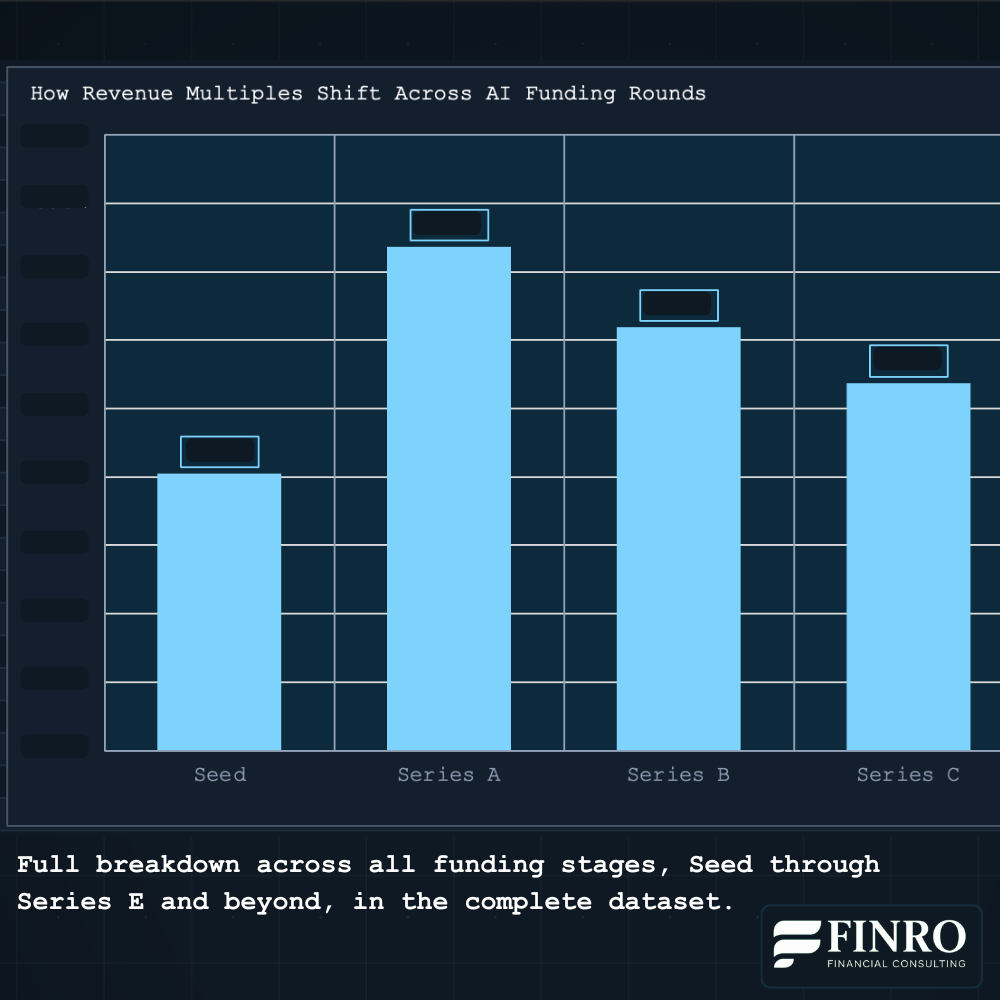
This database is organized around comparability. The spread matters as much as the average. A Seed-stage AI company raises at roughly 20x revenue on average. By Series C, that median compresses to around 27x, but with significant variance depending on niche. An LLM Vendor prices very differently from a Legal Tech SaaS, even at the same stage. The structure of this database makes those differences visible and usable.
Every company is tagged by niche, AI category, business type, and financial profile. It reflects the same benchmarking logic Finro uses in live valuation and financial modeling engagements.
FAQ
What format does the dataset come in? A structured spreadsheet compatible with Excel and Google Sheets. Includes the main database, niche summaries, round-by-round analysis, quarter-over-quarter comparisons, and dedicated tabs for Agentic AI, Core AI, and Applied AI.
What is the data cutoff? Q1 2026. The dataset is part of Finro's ongoing quarterly research series.
Can I use this for client work? Yes, single-user license for professional use. Contact us before purchasing if you need a team license.
What if I need help interpreting the data? The dataset includes structured notes for context. You can also book a call with the Finro team if you want a guided session.
Looking for a different sector? Finro also publishes multiples databases for Fintech, EdTech, Cybersecurity, and PropTech. Browse all datasets.
Want more context before purchasing? Read the latest AI valuation analysis here.
This is a non-refundable digital product. The information provided in this document is for informational purposes only and should not be regarded as investment advice or a recommendation regarding any particular security or course of action. Neither, Finro Limited (“Finro”) nor any of its affiliates makes any representation or warranty or guarantee as to the completeness, accuracy, timeliness or suitability of any information contained within any part of the Report nor that it is free from error.
Finro does not accept any liability (whether in contract, tort or otherwise howsoever and whether or not they have been negligent) for any loss or damage (including, without limitation, loss of profit), which may arise directly or indirectly from use of or reliance on such information. Information in this report was obtained from publicly available sources, information obtained from the client or Finro’s internal analysis, projections and estimations.
Please read the full disclaimer in the spreadsheet before using the data.