
Cybersecurity valuations vary widely depending on the company’s niche, stage, and strategic relevance, with Cloud Security, Data Security, and IAM commanding the highest multiples due to their critical roles in modern infrastructure. While public companies show more conservative valuations, private funding and M&A activity continue to reflect strong growth expectations, especially in high-demand segments.
Meanwhile, undervalued sectors like OT/IoT Security present hidden opportunities, particularly for acquirers. Across the board, metrics such as revenue, funding, and ARR remain foundational to any credible valuation analysis—underscoring the need for context-specific benchmarks when assessing early-stage startups or mature players in this fragmented market.
Cybersecurity Valuation Multiples Mid-2025: Benchmarks Across Security Niches
Author
Lior Ronen
Founder of Finro Financial Consulting. Personally leads every valuation, modeling, and M&A advisory engagement.
View Lior's profile →
Analysis by
Finro Financial Consulting
Startup valuation, financial modeling, and M&A advisory for AI, fintech, and SaaS companies. Serving funded tech startups from pre-seed through pre-IPO.
About Finro →This mid-2025 update summarizes selected insights drawn from Finro’s cybersecurity valuation database covering public companies, private startups, and M&A transactions.
Cybersecurity remains one of the most active and well-funded corners of tech, with new startups getting funded, acquired, or hitting new revenue milestones almost weekly. But with market conditions constantly shifting, it’s harder than ever to tell what a fair valuation looks like, especially across different business models and niches.
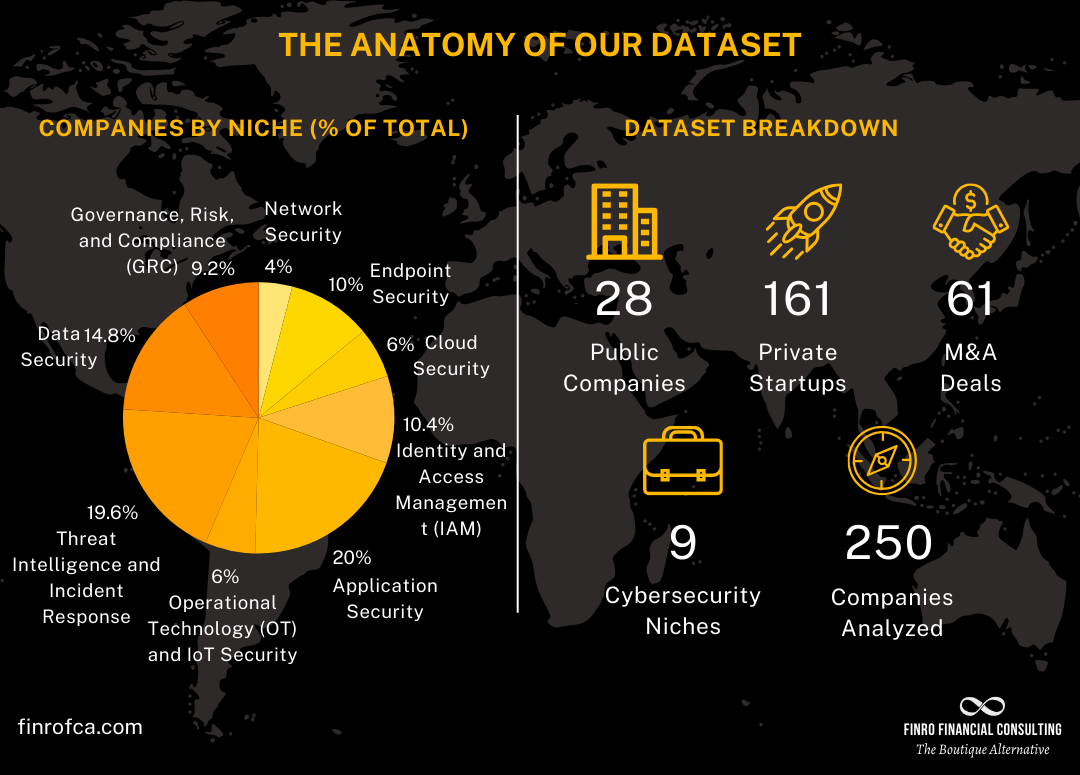
To ground the analysis, we reviewed 250 cybersecurity companies, including public firms, late-stage startups, and recent M&A deals. This mid-2025 snapshot focuses on metrics like revenue multiples and funding raised, broken down by niche and company type. Whether you’re building a startup or advising one, this data gives you a clearer sense of what investors and acquirers are paying for.
The article reviews our findings, identifies trends, and highlights a few outliers worth noting. These benchmarks are derived from Finro’s cybersecurity valuation dataset spanning public benchmarks, private funding rounds, and M&A transactions across multiple security niches.
TL;DR
Topics covered in this article
- Understanding Cybersecurity and How These Startups Are Valued
- Niches Overview
- How Founders and Investors Apply These Multiples?
- Related infrastructure and platform valuation research
- Metrics Used in This Analysis
- Valuation Benchmarks by Niche
- Valuation Multiples by Deal Type: What the Gaps Really Tell Us
- Conclusion
- Key Takeaways
- Answers to The Most Asked Questions
Understanding Cybersecurity and How These Startups Are Valued
Cybersecurity has become one of the most critical pieces of the modern tech stack. It’s not just about preventing attacks — it’s about building trust, protecting customer data, ensuring business continuity, and meeting growing regulatory demands.
As digital transformation accelerates across industries, companies face more exposure to cyber threats than ever before.
That exposure has created a massive market for startups offering security solutions — from protecting cloud environments and managing user identities to detecting advanced threats and responding in real time.
Startups in this space don’t just offer tools — they provide infrastructure-level protection. Many cybersecurity products are deeply embedded into enterprise workflows, which gives them high retention rates and sticky customer relationships.
This makes cybersecurity an especially appealing sector for investors and acquirers who are looking for recurring revenue, technical defensibility, and strong unit economics.
But valuing cybersecurity startups isn’t one-size-fits-all. Some niches, like cloud security or identity and access management, command a premium due to their relevance and scalability. Others might face pricing pressure or slower enterprise adoption.
While revenue growth is still a key driver, investors are increasingly focused on product differentiation, market positioning, and the ability to scale efficiently.
Over the past few years, we’ve seen a wide spread in revenue multiples across the sector — from early-stage startups with little revenue but strong strategic value, to growth-stage leaders raising capital at double-digit multiples.
This analysis covers 250 cybersecurity companies and looks at how valuations differ across nine core categories. Before diving into the numbers, we’ll walk through the niches included in our dataset and explain what each one focuses on.

Niches Overview
To make sense of valuation trends across cybersecurity, we first grouped the 250 companies in the dataset into 9 main niches. These aren’t arbitrary buckets — they reflect how the market actually segments, based on the problem each company is solving and the layer of infrastructure it’s protecting.
While some companies straddle multiple categories, we assigned each one to the niche that best represents its core offering. This breakdown helps bring structure to an otherwise fragmented market and allows for more meaningful comparisons between business models, growth profiles, and revenue multiples.
Here’s a closer look at the 9 cybersecurity niches included in this analysis:
Network Security
This is one of the most established areas of cybersecurity. It includes companies focused on securing the underlying network layer — firewalls, intrusion prevention systems, and secure gateways. The space is dominated by public players like Palo Alto Networks and Check Point, who offer broad product suites and have been expanding into adjacent niches. Network security tends to attract large enterprise customers and offers strong recurring revenue profiles.
Endpoint Security
Endpoint players focus on protecting the devices that connect to the network — laptops, mobile phones, and servers. These companies typically offer EDR (Endpoint Detection and Response) or XDR (Extended Detection and Response) solutions. CrowdStrike and SentinelOne are standout names in this category. Because endpoints are the most common entry points for attacks, demand in this segment continues to grow across both SMBs and large enterprises.

Cloud Security
With the shift to cloud-native architectures, companies in this niche focus on securing workloads, cloud configurations, APIs, and access. Leaders like Zscaler, Cloudflare, and Orca Security help businesses monitor and protect assets in AWS, Azure, and Google Cloud environments. This category is still evolving quickly, often with high growth rates but also significant variance in revenue scale.
Identity and Access Management (IAM)
IAM sits at the intersection of security and productivity, handling how users log in, what they can access, and how credentials are managed. Solutions range from single sign-on (SSO) to multi-factor authentication and privilege access controls. Okta, CyberArk, and ForgeRock are key players here. As remote work and SaaS usage expanded, IAM has become central to enterprise security strategies.
Application Security
This niche includes companies that protect software applications during development and deployment. They focus on detecting vulnerabilities in code, managing software supply chain risk, and scanning for misconfigurations in production. Companies like Snyk, Salt Security, and Checkmarx operate here. Application security has become a hot space due to the growing complexity of DevOps environments and rising software supply chain risks.
Operational Technology (OT) and IoT Security
These companies specialize in securing physical infrastructure — factories, energy grids, medical devices, and smart systems — where traditional IT security tools don’t apply. Claroty, Nozomi Networks, and Dragos lead the way. The OT/IoT niche is gaining investor interest as awareness of infrastructure attacks increases, though sales cycles are typically longer and more regulated.
Threat Intelligence and Incident Response
This niche covers companies that help detect, monitor, respond to, and recover from security incidents. They offer SOC-as-a-service, threat hunting, and MDR/XDR capabilities. Rapid7, Arctic Wolf, and ReliaQuest are well-known in this space. It’s a broad and competitive category, with a mix of public companies and fast-growing venture-backed players.
Data Security
Companies in this group protect sensitive information across systems — including data discovery, classification, encryption, and loss prevention. Varonis, BigID, and Cyera are examples. As privacy regulations tighten and data volumes grow, this niche has become a key focus for both enterprises and regulators.
Governance, Risk, and Compliance (GRC)
GRC platforms help businesses track risks, manage compliance efforts, and build audit-ready processes. This is where companies like OneTrust, Vanta, and LogicGate come in. The niche is especially relevant for sectors with heavy regulatory oversight, like finance and healthcare, and tends to generate strong SaaS metrics due to its system-of-record nature.
Each niche brings different growth profiles, pricing strategies, and market dynamics. This segmentation is what makes cybersecurity one of the most nuanced sectors for valuation — and what makes analyzing it so important.
Next, let’s break down the metrics we used to analyze these 250 companies — and what they reveal about how cybersecurity startups are being valued today.

How Founders and Investors Apply These Multiples?
Valuation benchmarks like these rarely sit in isolation. In practice, founders and investors use structured multiples to test fundraising narratives, evaluate strategic options, and align expectations across boards, acquirers, and capital providers.
At Finro, these datasets are integrated into broader valuation advisory engagements, financial models, and M&A positioning work. The objective is not only to reference market ranges, but to understand where a company fits within them — and how shifts in efficiency, growth, and product focus influence valuation outcomes.
Learn more about Finro’s valuation advisory work.
Related AI and infrastructure valuation research
Cybersecurity valuation trends increasingly align with broader infrastructure and AI market dynamics, where revenue durability, platform depth, and operational integration drive premium outcomes.Metrics Used in This Analysis
To offer a grounded and comparative view of cybersecurity valuations, this analysis relies on a consistent set of financial metrics applied across 500+ cybersecurity companies, including public firms, venture-backed startups, and recent M&A transactions.
These metrics are calculated using actual enterprise values, revenues, EBITDA, and funding figures sourced from financial databases, company disclosures, and third-party research platforms.
Core Metrics
Before diving into valuation multiples, it’s critical to understand the underlying metrics we used as inputs. These core figures—enterprise value, revenue, EBITDA, and total funding—form the basis for all the ratios and comparisons in this report.
Enterprise Value (EV)
EV is a measure of a company’s total value, including equity, debt, and minority interest, minus cash. It allows us to compare companies regardless of their capital structure. For public companies, EV is based on current market capitalization and balance sheet data. For M&A transactions, it reflects the announced deal value. For private companies, we used the most recent post-money valuation or publicly reported estimates.
Revenue
For public companies, revenue data is taken from annual or trailing 12-month (TTM) figures. For startups, we relied on annual recurring revenue (ARR) when reported, or estimated top-line revenue using reputable sources such as ZoomInfo, Latka, or company press releases. While not all private revenue figures are precise, we prioritized consistency across the dataset.
EBITDA
Where disclosed, EBITDA provides a view of a company’s underlying profitability, excluding non-operational and non-cash expenses. It’s particularly useful when assessing mature companies or profitable M&A targets. In this dataset, many early-stage startups operate at a loss, so EBITDA is not always available.
Total Funding
We tracked total disclosed funding (including debt and equity rounds) as a benchmark for understanding capital efficiency. This is especially relevant in today’s environment, where many cybersecurity startups raised significant capital during the 2020–2022 boom.
Full Spectrum of Valuations
The analysis includes 250 cybersecurity companies, broken down into 92 public firms, 118 private startups, and over 40 recent M&A transactions. This mix provides a comprehensive view of how valuations play out across different stages—from early-stage funding rounds to mature public benchmarks and strategic acquisitions. It also allows for meaningful comparisons between public market multiples, investor expectations in private rounds, and real-world deal terms in M&A.
The analysis includes 250 cybersecurity companies, broken down into 92 public firms, 118 private startups, and over 40 recent M&A transactions. This mix provides a comprehensive view of how valuations play out across different stages—from early-stage funding rounds to mature public benchmarks and strategic acquisitions. It also allows for meaningful comparisons between public market multiples, investor expectations in private rounds, and real-world deal terms in M&A.
Calculated Multiples
These ratios provide context for how companies are valued relative to their size or performance. While no single multiple can tell the full story, these three offer a strong baseline for comparison.
EV/Revenue
This is the most widely used valuation multiple in this analysis. It allows apples-to-apples comparisons across public and private companies, regardless of profitability. High-growth cybersecurity startups often command 15x–30x revenue multiples, particularly in high-demand niches like IAM and Cloud Security. Public company averages tend to fall between 5x and 12x, depending on their growth and profitability.
EV/EBITDA
When EBITDA data is available, this multiple helps us compare companies on a profitability basis. It’s particularly valuable for M&A deals and public companies, where buyers and investors weigh return on capital, not just growth.
EV/Funding
This ratio reflects how efficiently a company has turned external funding into enterprise value. A higher multiple indicates better capital efficiency or greater investor confidence. It’s a useful gut-check for startup valuations, especially in cases where revenue is still modest.
Zooming In: What the Multiples Reveal
Across all cybersecurity niches, the average EV/Revenue multiple stands at 13.3x—but that’s only part of the story. Some verticals like Cloud Security (21.7x) and IAM (15.0x) trade at much higher multiples, reflecting their rapid growth and strategic importance. Others, such as Operational Technology or Threat Intelligence, show more conservative averages, often due to infrastructure-heavy business models or lower scalability. Understanding these variations is key to making smart comparisons.
Data Sources and Transparency
Each metric in our dataset includes a source link—Yahoo Finance, Crunchbase, PitchBook, press releases, or investor presentations. When exact figures weren’t disclosed, we used Finro estimates based on available ARR benchmarks, revenue per employee ratios, or peer company comparisons. These cases are clearly marked in the dataset. We prioritize transparency over perfection: if we can’t reasonably verify a number, we don’t include it.
This emphasis on traceable and consistent inputs is what makes the valuation benchmarks in this report useful for founders, investors, and M&A advisors alike.
Now that we’ve laid out the methodology, let’s explore how these metrics and multiples vary across cybersecurity niches—from Endpoint Security and Cloud Infrastructure to Identity & Access Management and Threat Intelligence.
The next section breaks down the average and median multiples for each niche and explains the market dynamics behind them.
Valuation Benchmarks by Niche
Cybersecurity is not a one-size-fits-all market. It’s a layered, segmented ecosystem where valuation multiples vary widely depending on the company’s niche, the maturity of its customer base, and its position in the broader security stack.
To reflect this complexity, our analysis breaks down revenue multiples across nine core niches, covering public companies, private startups, and recent M&A deals.
While the full dataset is available for download, the highlights below offer a glimpse into how valuations are distributed—and where the market sees the most potential.
5 Key Takeaways from the Data
1. Cloud Security commands the highest valuations.
With an average revenue multiple of 21.7x and a remarkable 35.5x in M&A transactions, Cloud Security is the top-performing niche by far. Its infrastructure-critical role and alignment with hyperscale adoption trends continue to make it the most aggressively valued category in the space.
2. IAM and Data Security show dependable strength across the board.
Both Identity and Access Management (IAM) and Data Security consistently attract strong valuations—averaging 15.0x and 16.9x, respectively—across public markets, private funding rounds, and M&A. Their foundational roles in enterprise architectures signal long-term investor confidence and resilience across cycles.
3. Public markets remain far more conservative.
Across all niches, public cybersecurity companies trade at a significantly lower average of 7.8x revenue, compared to 15.2x in private transactions and 16.3x in M&A. This valuation gap points to a more restrained public market environment that hasn’t yet caught up with the optimism shown by acquirers and venture investors.
4. Application Security leads in deal volume, but still performs well.
As the most active niche in the dataset with 50 companies analyzed, Application Security shows that market saturation doesn’t necessarily suppress valuations. Despite the crowd, the segment maintains a strong 12.1x average, highlighting that well-positioned players can still stand out.
5. OT & IoT Security is undervalued by public markets but prized in acquisitions.
This is the only segment showing a dramatic split: public companies trade at just 1.8x, while M&A deals reach 17.5x. The gap likely reflects skepticism around hardware dependencies and deployment friction—yet acquirers are clearly betting on its long-term relevance as industrial and physical systems become more connected.
Together, these trends illustrate a cybersecurity market that is dynamic and highly dependent on niche positioning. High-growth areas like Cloud Security and Data Security continue to attract premium valuations, while strategic gaps—such as those in OT/IoT—create opportunities for savvy acquirers.
Next, we’ll explain how valuation multiples shift based on deal type, exploring the differences between public market comps, private funding rounds, and M&A transactions.

Valuation Multiples by Deal Type: What the Gaps Really Tell Us
aluation isn’t just about company performance—it’s also about context. Whether a cybersecurity company is publicly listed, privately funded, or acquired in an M&A deal dramatically impacts how it’s priced. In our dataset, the differences are clear: public companies trade at an average of 7.8x revenue, private startups at 15.2x, and M&A deals top the list at 16.3x.
These gaps aren’t random. They reflect how different stakeholders assess risk, growth potential, and strategic fit.
Public markets, for example, are the most cautious. Investors reward stability, predictability, and efficient operations—especially in today’s higher-interest rate climate. Even strong cybersecurity companies face pressure to show profitability, resulting in lower revenue multiples despite solid fundamentals.
In contrast, private markets still reward growth. Venture investors continue to fund startups with high ARR growth, sticky customer bases, and expansion potential, particularly in cloud infrastructure, identity, and data protection. These fundamentals push valuations higher, often into the mid-teens or above, as investors bet on future dominance over near-term margins.
But it’s in M&A where the most significant premiums emerge. Strategic acquirers are often less price-sensitive if the target offers immediate synergies: a complementary product line, access to new enterprise customers, or a differentiated AI capability. For the right asset, it’s not uncommon to see 25–35x revenue multiples—especially in niches like Cloud Security or Identity and Access Management (IAM), where incumbents are racing to build full-stack platforms.
Interestingly, these dynamics also reveal potential opportunity areas. For instance, OT and IoT Security companies are heavily discounted in public markets—averaging just 1.8x revenue—but command much higher multiples in M&A deals (17.5x). This suggests that while public investors may be wary of hardware-related risks or adoption barriers, acquirers are willing to bet on the long-term need to secure industrial systems and critical infrastructure.
Ultimately, the disparity between deal types offers more than just a snapshot of market behavior—it provides a roadmap for founders, investors, and acquirers. Founders should understand how timing and exit path impact valuation expectations. Investors should calibrate their models with these differences in mind. And acquirers can spot underpriced assets by watching where public skepticism misaligns with strategic need.
Ultimately, the disparity between deal types offers more than just a snapshot of market behavior—it provides a roadmap for founders, investors, and acquirers alike. Founders should understand how timing and exit path impact valuation expectations. Investors should calibrate their models with these differences in mind. And acquirers can spot underpriced assets by watching where public skepticism misaligns with strategic need.
If these high-level insights are helpful, they’re just scratching the surface. The full dataset includes 250+ cybersecurity companies—categorized by niche, deal type, and valuation multiple—giving you a comprehensive benchmarking tool to evaluate where your company (or portfolio) stands.

Why Download the Full Dataset?
This article offers a curated view of valuation trends, but the real depth is in the underlying data.
Our full cybersecurity valuation spreadsheet includes detailed data on 250 companies, broken down by deal type, niche, and valuation stage. It covers:
28 public companies
161 private startups
61 M&A deals
9 cybersecurity niches, including Cloud Security, IAM, Application Security, and more
Each company entry comes with core metrics (revenue, EBITDA, funding) and calculated multiples (EV/Revenue, EV/EBITDA, EV/Funding), so you can confidently benchmark any deal.
But it’s not just rows of raw data. The file also includes:
Summary Tabs with average multiples per niche, per deal type, and per stage.
Charts and visualizations comparing public, private, and M&A trends
Pre-built filters and insights to help you analyze by segment or region faster
A structured, clean Excel format that’s ready to plug into your own model or pitch deck
Whether you’re a founder, investor, corp dev professional, or financial analyst, this dataset gives you clarity on how the market is actually pricing cybersecurity deals today.
The full spreadsheet is available for €79.90 and is updated semi-annually to reflect the most recent market activity.
Thinking About Your Next Valuation Step?
Share your stage, context, and objective, and we’ll outline how we would frame the valuation, what assumptions matter, and where investors will focus.
Typical next step: a 15 to 20 minute strategy call.
Conclusion
Cybersecurity is one of the most complex and fast-moving sectors in tech, and this shows in the way these companies are valued.
Across this article, we’ve broken down the structural factors shaping valuation, from niche-specific dynamics to core metrics, revenue multiples, and strategic deal trends. The key takeaway? Valuation in this space isn’t a matter of broad benchmarks or market hype. It’s contextual, fragmented, and increasingly shaped by each startup's critical role within the larger security stack.
From Cloud Security’s commanding multiples to the undervaluation of OT/IoT players in public markets, the data reveals not just what the market is doing, but why it’s doing it and understanding why, whether you’re a founder, investor, or corp dev lead, differentiates between a good decision and a costly misread.
However, insights like these only go so far without access to the underlying data. We’ve compiled the Cybersecurity Valuation Multiples Database to give you a clear, structured view of over 250 companies across 28 public, 161 private, and 61 M&A deals—organized by niche, valuation type, and strategic relevance.
This dataset sharpens your lens whether you’re refining your own valuation, preparing a board deck, or advising clients.
Key Takeaways
1. Cloud Security Leads: Cloud Security commands the highest multiples across all deal types, driven by its critical infrastructure role and sustained hyperscale demand.
2. Public Markets Are Conservative: Valuations in public markets trail behind private and M&A deals, highlighting investor caution versus aggressive private and acquisition pricing.
3. IAM and Data Security Stay Strong: Identity and Data Security show balanced strength across public, private, and M&A markets, signaling long-term strategic value.
4. Volume Doesn’t Equal Weakness: Application Security is the most active niche by company count and still maintains a strong average multiple despite high competition.
5. OT/IoT’s Valuation Gap: OT and IoT Security are undervalued in public markets but sought after in M&A, revealing overlooked growth potential.
Answers to The Most Asked Questions
-
Private cybersecurity startups average a 15.2x revenue multiple in 2025, with M&A deals at 16.3x and public companies trailing at 7.8x.
-
Cloud Security leads with the highest revenue multiples—21.7x on average, and up to 35.5x in M&A—driven by critical infrastructure and enterprise demand.
-
Public markets apply stricter pricing and risk adjustments, while private investors and acquirers factor in higher growth potential and strategic acquisition value.
-
Investors use revenue multiples based on niche, growth, margins, and deal type—often benchmarking against public comps, recent M&A, and funding rounds.
-
Application Security is the most active with 50 companies analyzed, followed by Cloud Security and IAM—reflecting strong product demand and innovation cycles.