
EdTech Valuation Multiples Q4 2025: Quality and Retention Take the Lead
This update summarizes selected insights drawn from Finro’s live valuation databases covering public companies, private startups, and M&A transactions.
After years of inflated expectations, EdTech valuations have settled into something measurable again. The market still rewards growth, but it now pays a premium for predictability, recurring contracts, low churn, and clear retention metrics.
These benchmarks are drawn from Finro’s EdTech valuation dataset covering public comps, private rounds, and M&A transactions.
Finro’s Q4 2025 dataset captures this shift across 271 observations from public, private, and M&A transactions. The industry has matured into a more disciplined valuation environment. Multiples remain healthy, but the logic behind them has changed. Revenue quality now matters more than revenue speed.
This is not a broad market overview. It is a data-driven look at how valuations are formed, how they differ across niches and stages, and what truly drives an EdTech startup’s valuation in 2025.
Need the full EdTech valuation benchmark?
Download the Excel dataset behind this analysis, covering 271 EdTech companies across 7 niches, with public, private, and M&A valuation data.
-
01EdTech valuations are more disciplined in 2025. Growth still matters, but it no longer justifies high multiples on its own. Investors are looking for efficiency, defensibility, retention, and clear customer economics.
-
02Early-stage optimism compresses quickly without proof. Young EdTech companies can still attract premium valuations, but those valuations become harder to defend without evidence of retention, margin strength, and scalable acquisition economics.
-
03B2B and SaaS-oriented EdTech models lead the sector. Enterprise-facing and recurring-revenue models tend to show stronger EV/Revenue and EV/Funding ratios, while consumer-facing platforms remain more exposed to acquisition costs and retention pressure.
-
04Capital efficiency is becoming the clearest durability signal. The strongest EdTech valuations are increasingly tied to how effectively each dollar raised turns into sustained enterprise value, not just how much capital the company has attracted.
-
05Valuation benchmarks need stage and niche context. A single EdTech revenue multiple is not enough. The useful benchmark depends on the company’s niche, stage, revenue model, customer base, retention profile, and capital efficiency.
Topics covered in this article +
- How EdTech valuations are priced in 2025: from market medians to efficiency benchmarks
- How founders and investors apply these multiples
- Related startup valuation benchmarks across sectors
- Where value concentrates: the niches that outperform
- How EdTech valuation multiples evolve across funding stages
- Why capital efficiency defines valuation durability
- Why download the full Q4 2025 EdTech valuation dataset
- Summary
- Key takeaways
- Answers to the most asked questions
How EdTech valuations are priced in 2025: from market medians to efficiency benchmarks?
The 2025 EdTech valuation landscape reflects a market that has matured into measurable consistency. Finro’s Q4 2025 dataset, covering 271 companies across public, private, and M&A transactions, shows that valuations have stabilized after years of volatility.
The median enterprise value to revenue multiple sits around 7.8x, while the median enterprise value to funding is roughly 3.8x. These two indicators have become the foundation of how the market values learning-technology startups today.
This balance between EV/Revenue and EV/Funding is what defines the new logic behind EdTech valuation multiples. EV/Revenue remains the headline number that founders and investors quote, but EV/Funding quietly determines which startups justify those prices.
A company can sustain a high revenue multiple only when it turns each dollar of investment into multiple dollars of enterprise value. In 2025, investors pay close attention to that conversion efficiency.
The distinction between public and private pricing adds another layer. Public EdTech companies tend to trade at lower EV/Revenue multiples but higher capital-efficiency ratios because their revenue bases are larger and more predictable.
Private EdTech startups often command higher valuation multiples, especially when they can show fast ARR growth and low churn. Yet even those private premiums depend on tangible proof that efficiency and retention are built into the business model.
This shift in pricing logic marks the end of valuation inflation and the beginning of valuation accountability. Growth stories still matter, but they need to be backed by measurable quality of earnings, solid contract structures, and evidence of repeatability.
For investors, EdTech valuation in 2025 is about risk-adjusted performance. For founders, it is about showing the data that connects revenue, retention, and funding to enterprise value.
The next section explores where these principles show up most clearly across niches, identifying which segments of the EdTech market still command premiums and why those premiums persist.

How do founders and investors apply these multiples?
Valuation benchmarks like these rarely sit in isolation. In practice, founders and investors use structured multiples to test fundraising narratives, evaluate strategic options, and align expectations across boards, acquirers, and capital providers.
At Finro, these datasets are integrated into broader valuation advisory engagements, financial models, and M&A positioning work. The objective is not only to reference market ranges, but to understand where a company fits within them — and how shifts in efficiency, growth, and product focus influence valuation outcomes.
Learn more about Finro’s valuation advisory work.
Where value concentrates: the niches that outperform
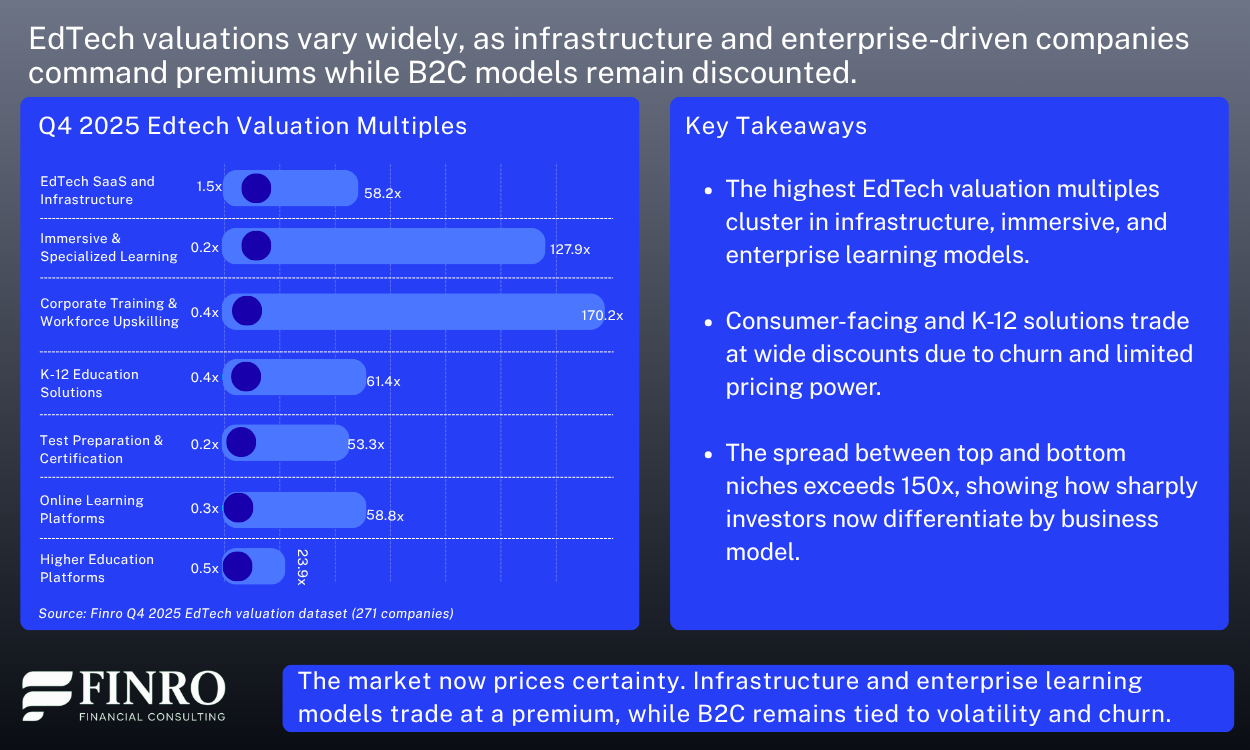
The 2025 dataset makes it clear that valuation premiums are not spread evenly across the EdTech landscape. A few niches consistently outperform, while others trade at deep discounts.
The strongest results appear in EdTech SaaS and infrastructure, where the median EV to revenue multiple reaches about 18.6x, more than double the market median of 7.8x. These companies provide the systems, APIs, and data frameworks that other learning platforms rely on, which gives them predictable, recurring revenue and high retention.
Corporate learning and upskilling platforms also rank near the top. Their enterprise clients renew multi-year contracts and expand usage over time, pushing valuation multiples into the 10–12x range. AI-driven learning tools form a rising tier, attracting strong investor attention as adaptive personalization improves engagement and lowers churn. Their multiples remain below SaaS infrastructure leaders but continue to trend upward as adoption spreads.
By contrast, consumer-facing EdTech models show weaker results. K-12 content platforms and direct-to-learner subscriptions often trade below 5x revenue because of higher customer acquisition costs, limited pricing power, and inconsistent retention. Their valuations depend heavily on marketing efficiency rather than structural stickiness.
The pattern is consistent: investors now assign the highest EdTech valuation multiples to companies that anchor themselves inside enterprise workflows or deliver technology infrastructure that other providers depend on. Models reliant on one-time transactions or seasonal demand struggle to convert growth into durable enterprise value.
The next section looks at funding stages, showing how these valuation dynamics evolve from early rounds to late-stage maturity and what signals investors watch most closely at each step.
How EdTech valuation multiples evolve across funding stages?
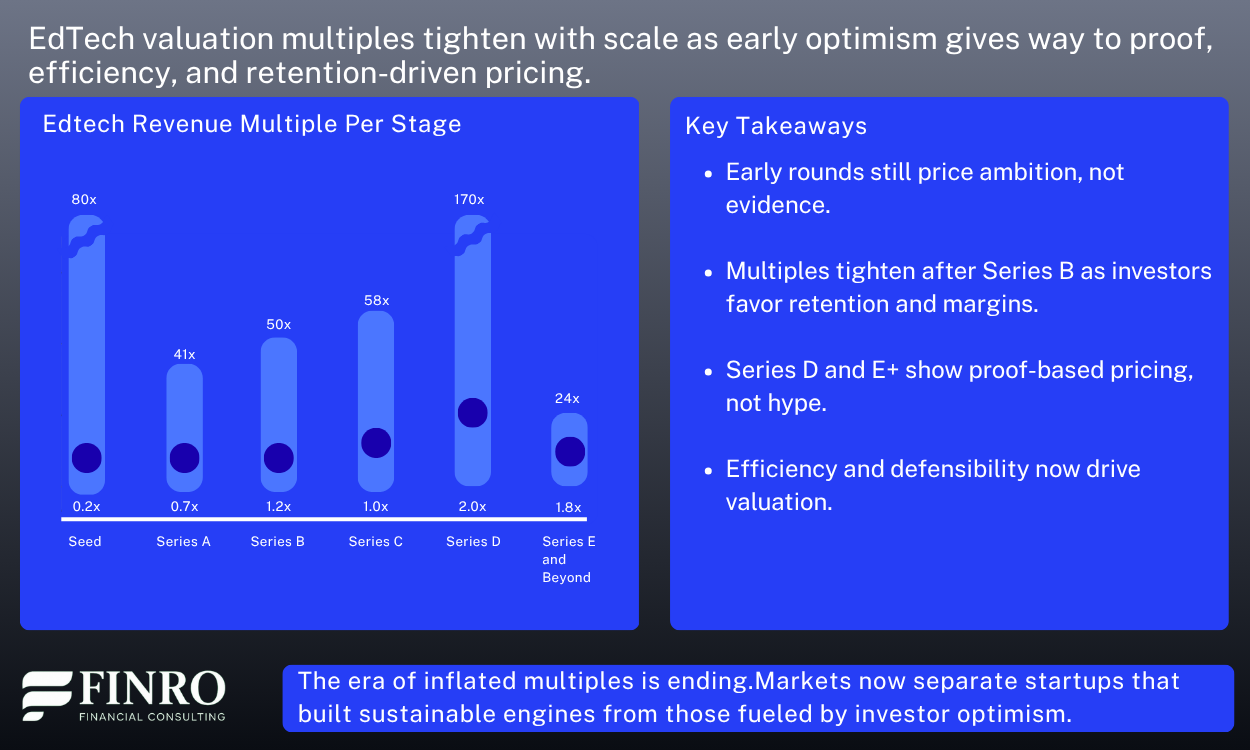
Building on the niche-level findings, the dataset also shows how valuation logic changes as EdTech startups mature. The spread between early and late-stage valuations has tightened in 2025, but not uniformly. Risk is still priced differently across rounds, and the compression pattern becomes clear once companies move beyond Series B.
At the Seed stage, average EV/Revenue multiples hover around 11.9x, with wide dispersion from 0.2x to 80x. Valuations at this stage often price ambition rather than performance — driven by early optimism about market opportunity and differentiation.
By Series A and B, averages remain near 10–10.5x, but the spread narrows significantly, reflecting a shift from narrative to early proof. These rounds still reward growth potential but begin to penalize weak efficiency and untested unit economics.
At Series C, the average climbs modestly to 16.2x, showing how investors reward startups that prove scalability with recurring revenue and retention. Still, the dispersion (from 1x to 58x) signals that not all companies crossing this stage are built equally — performance consistency separates those priced as category leaders from the rest.
In later stages (Series D and E+), the averages stabilize at 26.0x and 12.8x, respectively, while upper limits contract sharply — from 170x at Series D to 24x at Series E+. Investors increasingly value defensibility, enterprise contracts, and profitability, while aggressive growth models see limited premium.
The pattern is consistent: valuation compression follows maturity, but high-performing startups can preserve their premium by proving efficiency and retention early. Those that rely purely on scale tend to meet valuation resets as they approach the later rounds.
The next section explores why capital efficiency has become the main differentiator in EdTech valuation — and how EV/Funding multiples now reveal which business models sustain value beyond growth.
Why Capital Efficiency Defines Valuation Durability?
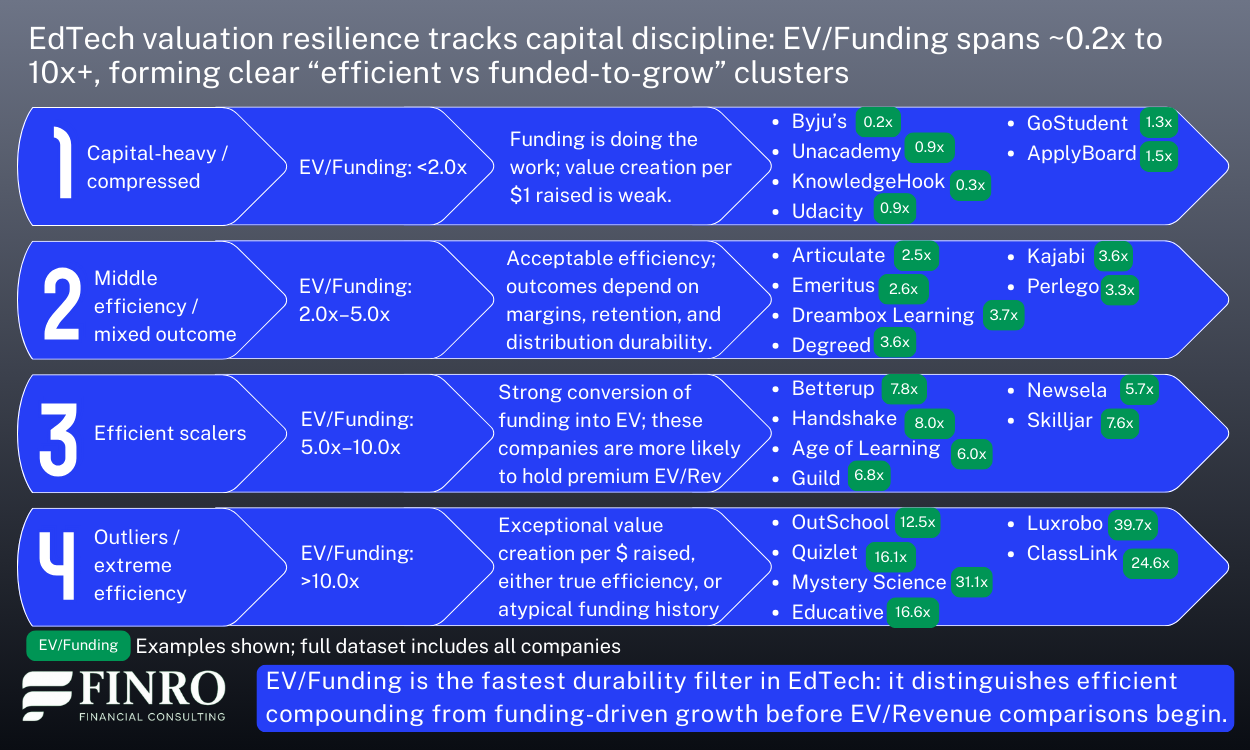
After mapping how valuation multiples evolve across stages, the next question is what helps certain startups hold their premium while others compress. The answer increasingly lies in capital efficiency, how effectively a company turns each dollar of funding into enterprise value.
Across the dataset, EV/Funding multiples highlight a sharp divide. Efficient EdTech startups generate $5–10 in enterprise value per $1 of capital raised, while heavily financed peers often create less than $2–3 of value per dollar. The pattern suggests that markets now reward sustainable scaling, not aggressive capital use.
Capital-efficient companies share a few consistent traits:
Retention-driven revenue: recurring models with low churn and strong lifetime value.
Controlled headcount growth: operational leverage is improving faster than expenses.
Measured fundraising cadence: smaller rounds, used to reach milestones before dilution.
When funding becomes the growth engine, multiples fade quickly. High burn rates signal dependency, not scalability, and investors adjust valuation logic accordingly. This explains why startups with leaner capitalization often preserve higher EV/Revenue multiples over time — their models scale organically, not financially.
From a valuation standpoint, EV/Funding now acts as the efficiency ratio of the EdTech sector. It captures how effectively each dollar raised translates into enterprise value, providing a clearer measure of durability than top-line growth alone.
The next section connects these insights to the full Q4 2025 dataset, where readers can explore each company’s multiples, efficiency ratios, and funding history in detail — and see why the complete workbook is worth downloading for anyone pricing or benchmarking an EdTech startup.
Why download the full Q4 2025 EdTech valuation dataset?
If you’ve followed this far, you already know the headlines: where multiples cluster, how they compress, and which niches reward efficiency.
The full dataset goes several steps deeper. It includes company-level metrics, filters, and ratios that turn a single snapshot into a benchmarking tool you can actually use.
The download includes:
271 companies across public, private, and M&A transactions.
Full EV/Revenue and EV/Funding data for every record so that you can trace both growth and efficiency stories.
Niche-level groupings: from Corporate Learning to EdTech SaaS & Infrastructure, to see where market appetite really concentrates.
Historical comparisons and peer ranges that help frame your next fundraise, valuation discussion, or acquisition target.
The full Excel dataset is available for €99.90, with quarterly updates included.
For founders, it short-cuts weeks of research when framing valuation expectations or preparing investor decks.
For investors, it surfaces which models scale capital efficiently and which are still chasing growth the hard way.
Delivered as a clean, filterable workbook, it lets you move from static benchmarks to live market context — so your valuation narrative always matches current market logic.
The next section wraps up the analysis, summarizing what 2025 says about how the market now prices efficiency, retention, and defensibility across EdTech.
Summary
The 2025 data confirms what many in the industry have sensed: EdTech has matured into a market that prices efficiency and defensibility, not just growth. Multiples now move with evidence, not optimism.
Niches that combine recurring revenue with capital discipline. Such as EdTech SaaS and Corporate Learning, continue to command valuation premiums. Consumer-oriented models, on the other hand, face a harder ceiling as investors prioritize retention and sustainable scaling over aggressive expansion.
Across rounds, the pattern is clear. Early optimism drives higher multiples at Seed and Series A, but by Series C, only companies with proven unit economics and predictable revenue retention sustain their value. The compression of late-stage multiples reflects a more rational market, one that increasingly rewards operational proof over storytelling.
Capital efficiency has become the real differentiator. Startups that can turn each dollar raised into measurable enterprise value are setting the new standard, and their multiples show it.
If there’s one takeaway from this dataset, it’s that EdTech valuation in 2025 is no longer about potential. It’s about proof.
Using EdTech benchmarks for a real valuation decision? Finro helps founders, CFOs, investors, and buyers apply niche, funding stage, retention, revenue quality, capital efficiency, and M&A data to company-specific valuation analysis.
- 1 EdTech valuation logic has become more evidence-driven. The 2025 market still rewards growth, but valuation premiums now depend more heavily on efficiency, defensibility, retention, and measurable customer economics.
- 2 Capital efficiency is now a core valuation signal. Startups that generate more enterprise value per dollar raised are better positioned to sustain stronger EV/Revenue and EV/Funding multiples.
- 3 Stage compression becomes more visible as companies mature. Early-stage optimism can still support higher multiples, but by Series C and later rounds, investors demand proof of retention, margins, and repeatable unit economics.
- 4 B2B and SaaS-oriented EdTech models outperform consumer-facing platforms. Recurring revenue, enterprise contracts, workflow integration, and lower churn create stronger valuation support than direct-to-consumer growth alone.
- 5 Operational proof now matters more than narrative. Investors increasingly reward retention, capital leverage, cohort quality, and margin visibility, not just category size or growth ambition.