AI Agents Valuation Multiples: Mid-2025 Update
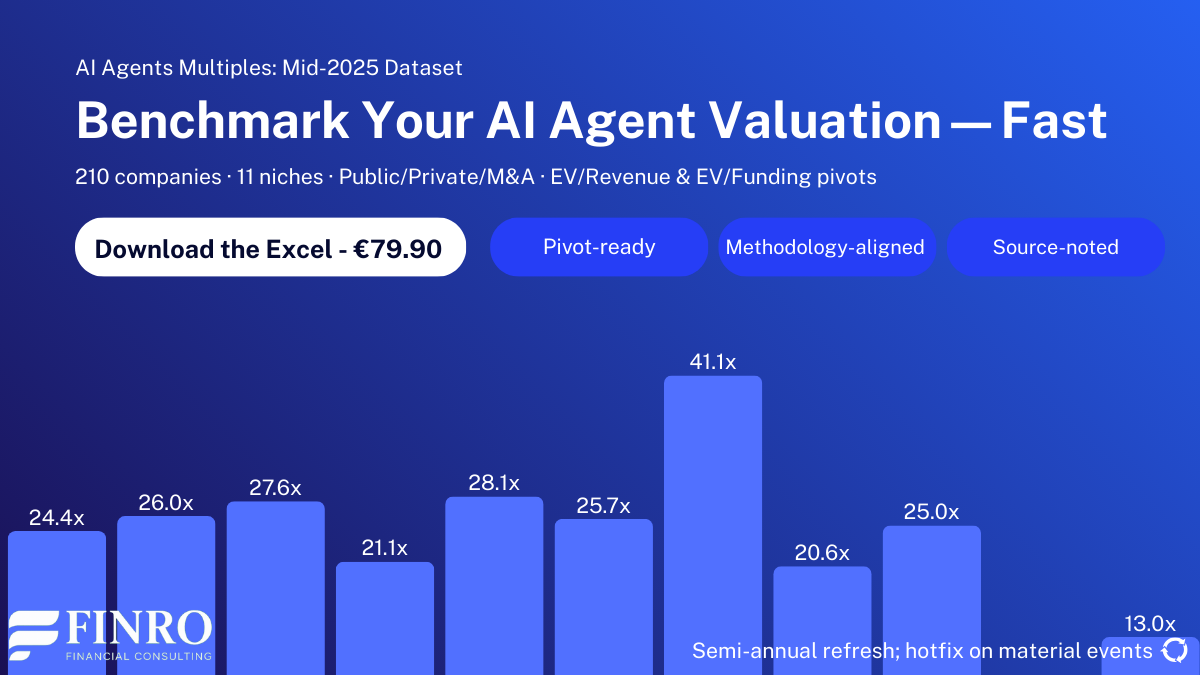
AI agents are no longer a novelty—they’re being priced like real businesses. Our mid-2025 dataset covers 210 companies across 10 niches (12 public, 191 private, 7 M&A) and tracks revenue multiples by niche, funding round, and deal type.
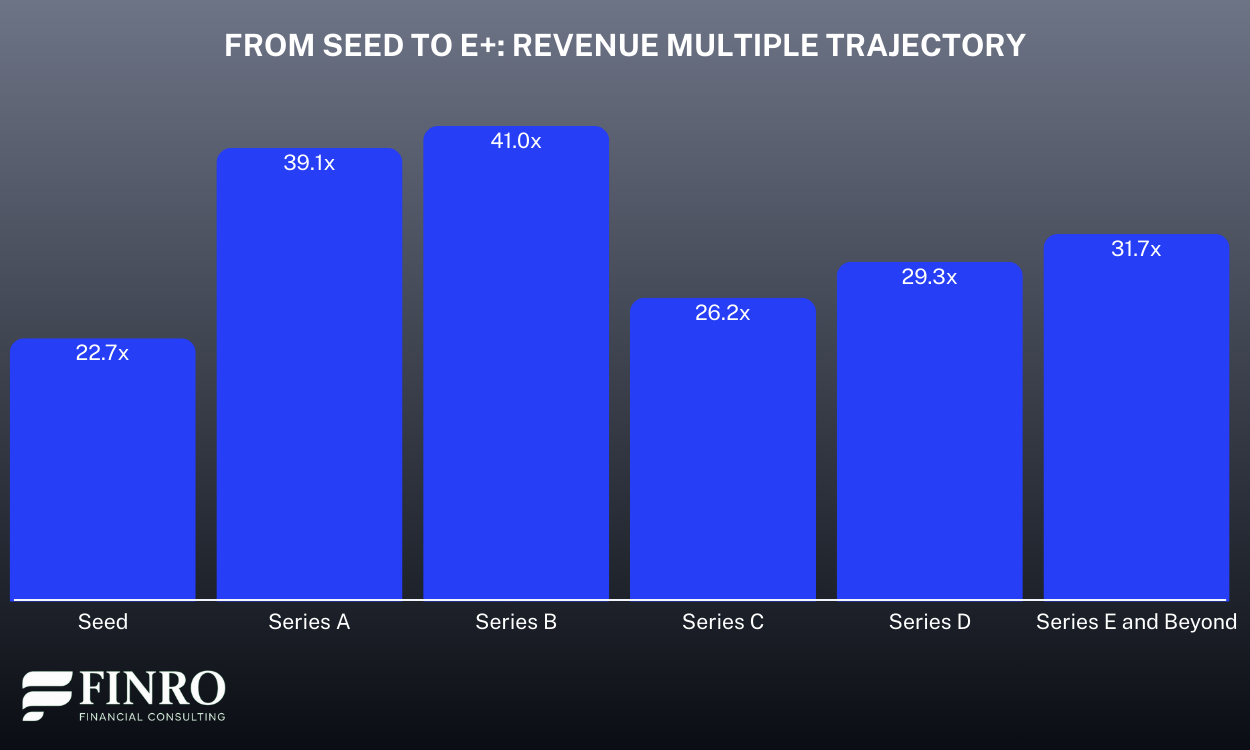
The valuation curve is clear: investor conviction rises fast from Seed at 22.7x to a peak at Series B (41.0x), nearly as high at Series A (39.1x), then compresses through Series C (26.2x) and Series D (29.3x) before recovering for proven late-stage platforms at Series E+ (31.7x).
Premiums concentrate where defensibility and workflow lock-in are strongest. Dev Tools & Autonomous Coding, Legal & Compliance, and Productivity & Internal Tools consistently price in the 30–50x range, reflecting scalable margins and mission-critical adoption.
Value tiers cluster at the opposite end: PropTech & Real Asset Ops, HR & People Ops, and parts of Sales & Customer Ops trade closer to 3–12x, signaling tougher paths to scale or weaker pricing power.
M&A deals generally clear at a discount to private rounds, though categories with demonstrable revenue quality, particularly Productivity and selected Sales & Customer Ops assets, can achieve parity or better. Strategic Anchors (OpenAI, Google, Microsoft, etc.) set the ceiling and are treated separately to keep comparisons clean.
The sections below unpack these patterns by niche and by stage. For the full company list, pivots, and formulas, grab the Excel and go deeper.
TL;DR

Scope & Methodology
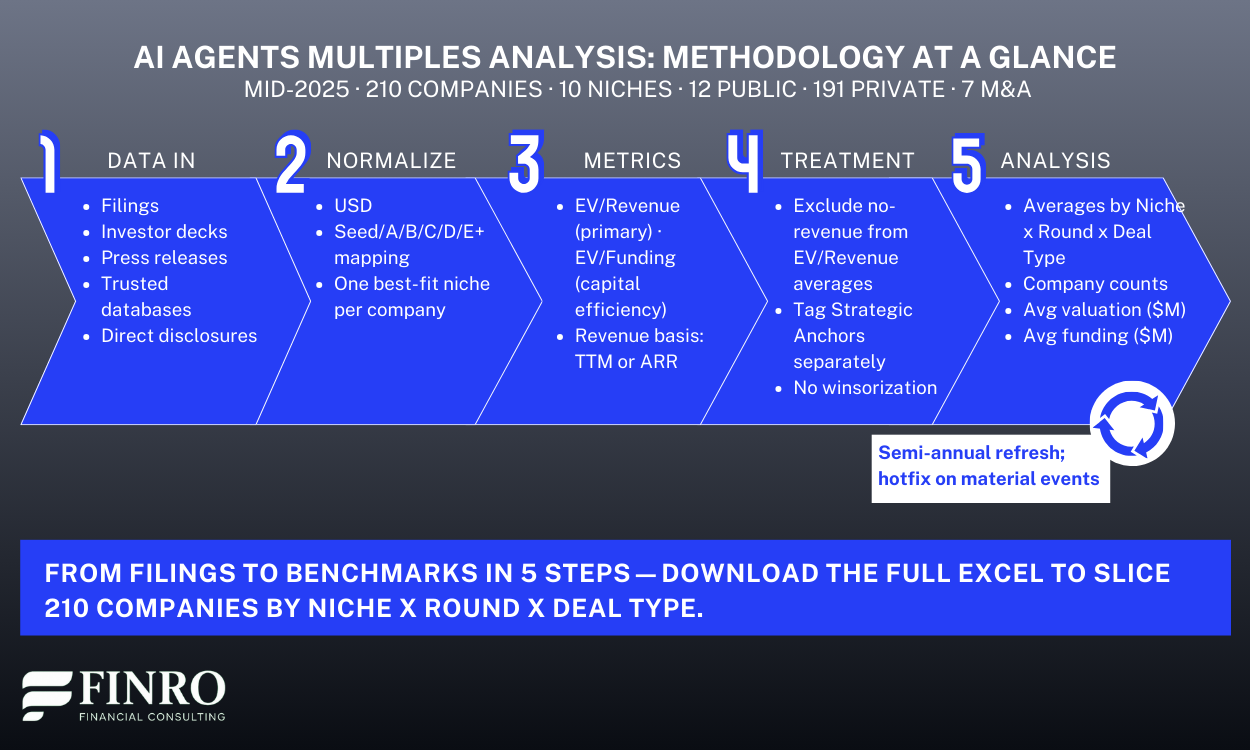
Coverage and scope. The mid-2025 cut tracks 210 AI agent companies across 10 niches and three deal types (public, private, M&A). Companies are assigned to a single “best-fit” niche to keep comparisons clean. Funding rounds are normalized to Seed, Series A, B, C, D, and E+; bridge/extension rounds are mapped to the closest main stage.
Core metrics. Valuation benchmarks use EV/Revenue as the primary multiple and EV/Funding as a capital-efficiency cross-check. Public comps rely on enterprise value over TTM revenue. Private rounds use post-money valuation over the latest disclosed annualized revenue (ARR or TTM, per disclosure). M&A deals use transaction EV over target revenue at signing/close. All figures are USD-denominated.
Data treatment. Companies without defensible revenue are excluded from EV/Revenue averages but remain in company counts. Strategic Anchors (e.g., OpenAI, Google, Microsoft) are tagged and analyzed separately to avoid skewing niche averages. Where sources disagree, the most recent investor-grade disclosure wins; otherwise, consensus from multiple reputable sources is used. Rounding follows standard conventions; no winsorization is applied—outliers are noted rather than suppressed.
Update cadence and sources. The dataset is refreshed semi-annually using public filings, investor decks, press releases, trusted market databases, and direct disclosures. Material changes (large rounds, acquisitions) are reflected at the next cycle or earlier if they materially shift a niche trend.
How to read the charts. Niche charts show average revenue multiples by deal type and total; stage charts plot the multiple trajectory from Seed through E+. Use the pair to triangulate “where you are” (stage) and “how you’re priced” (niche), then benchmark against capital intensity via EV/Funding.
With the rules of the road set, the next section maps the ten niches—crisp definitions first, so the charts and insights land with context.
Market Map: How to Read the AI Agent Landscape
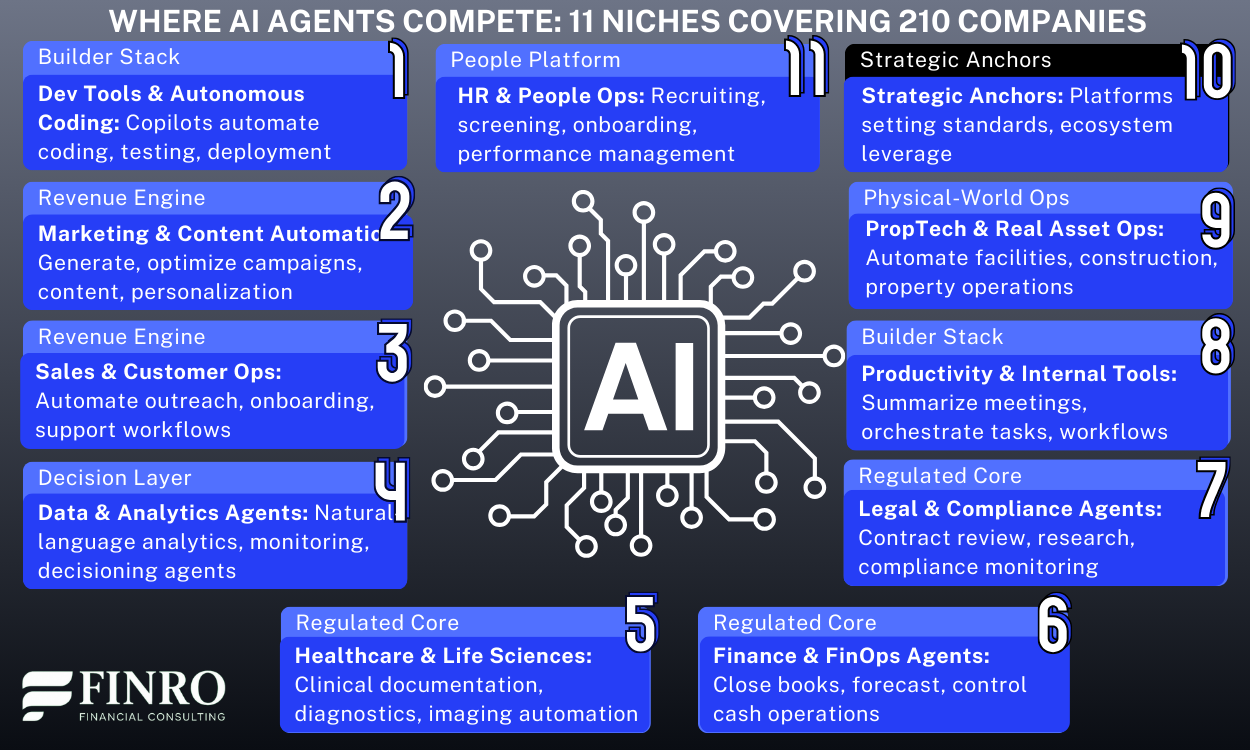
Methodology set and legend above. Rather than a niche-by-niche glossary, we organize the landscape into six buyer-driven workstreams and a separate Strategic Anchors lens to avoid skew.
This framing makes it clear who buys, what job each cluster does, and why certain categories command premium multiples while others trade at a discount.
Regulated Core Systems (Legal & Compliance; Healthcare & Life Sciences; Finance & FinOps)
Risk reduction and auditability drive purchase decisions here. Buyers are GC/Compliance, hospital ops/CMO, and CFO/Controller. Value shows up as lower error rates, throughput gains, and provable control frameworks. When evidence is strong, switching costs and defensibility support premium pricing.
The Builder Stack (Dev Tools & Autonomous Coding; Productivity & Internal Tools)
Anything that moves code or meetings faster. Buyers are CTO/VP Eng and COO/IT. Bottoms-up adoption, daily-use workflows, and seat expansion push NRR up and payback down—often earning top-tier SaaS multiples when usage is sticky.
The Revenue Engine (Marketing & Content Automation; Sales & Customer Ops)
Owned by CMO/CRO. ROI is legible (pipeline coverage, CAC, cost-to-serve), but budgets are scrutinized and churn risk is visible. Multiples hinge on revenue quality (contracted vs. campaign-based) and depth of integration with CRM/ad stacks.
The Decision Layer (Data & Analytics Agents)
Natural-language analytics, monitoring, and decision support. Buyers are Heads of Data/BI and functional leaders. Moats come from integrations, governance, and time-to-answer. Pricing power improves when agents sit in the loop of real decisions, not just dashboards.
Physical-World Ops (PropTech & Real Asset Ops)
Facilities, construction, and asset operations. Savings are tangible, but deployments can be complex and services-heavy. Investors discount when margins look implementation-led or sales cycles stretch—execution quality determines whether multiples compress or recover.
People Platform (HR & People Ops)
Talent teams buy for speed and quality of hire. Strong compliance angles exist, but budget sensitivity and vendor swap-outs cap pricing power unless the product embeds across workflows and surfaces measurable hiring outcomes.
Strategic Anchors (separate lens) (OpenAI, Google, Microsoft, etc.)
Platforms that set technical standards and influence pricing corridors. Included for context, excluded from averages so they don’t skew niche benchmarks.
With the clusters defined, let’s quantify where investors actually pay up—starting with Benchmarks by Niche and the chart on average revenue multiples, followed by the key takeaways it surfaces.
Benchmarks by Niche
With the market map set, we can now see how the market prices each cluster.
The dataset spans 210 companies across 11 niches; by count, Dev Tools & Autonomous Coding (~50) is the largest, followed by Marketing & Content Automation (~34), Healthcare & Life Sciences (~25), and Finance & FinOps (~23). Smaller cohorts like Legal & Compliance (~8), PropTech & Real Asset Ops (~4), and HR & People Ops (~2) provide a proper signal but with wider variance.
Three patterns stand out in the multiples:
Premium clusters (top quartile).
Dev Tools & Autonomous Coding, Legal & Compliance, and Productivity & Internal Tools consistently clear at the high end (roughly 30–50x EV/Revenue, depending on deal type). These categories sit close to daily workflows, show durable usage, and build defensibility through data, compliance, or workflow lock-in.
Middle band with proof-driven pricing.
Marketing & Content Automation, Data & Analytics Agents, and parts of Healthcare & Life Sciences trade in the high-20s to low-30s. Pricing power tracks with measurable ROI (CAC efficiency, time-to-insight) and integration depth into CRM, ad stacks, or clinical systems.
Value clusters (discount to market).
PropTech & Real Asset Ops, HR & People Ops, and portions of Sales & Customer Ops sit at single-digit to low-teens on average. Longer deployments, services mix, budget sensitivity, or churn risk tend to compress multiples unless vendors are deeply embedded.
Two nuances matter when you read the chart:
Deal type effects. M&A typically prices below private rounds; however, categories with visible operating leverage (e.g., Productivity, select Sales & CS assets) can achieve parity or premiums when revenue quality is proven.
Anchor effect. Strategic Anchors (OpenAI/Google/Microsoft) set the ceiling and shape expectations but are analyzed separately to keep niche averages comparable.
Next, we step away from categories and look at stage dynamics—how revenue multiples move from Seed to Series E+, where the curve peaks, where it compresses, and what that implies for timing your round.

Benchmarks by Funding Round
With the categories mapped and priced, the next lens is stage. The curve isn’t linear: revenue multiples rise from Seed ~22.7x to a peak at Series B ~41.0x (nearly as high at Series A ~39.1x), compress at Series C ~26.2x and Series D ~29.3x, and then rebound for proven platforms at Series E+ ~31.7x.
What this says about investor conviction
A–B premium = belief in scale. These rounds reward clear product–market fit, repeatable GTM, and improving unit economics. Story still matters, but it’s backed by usage curves, NRR, and sales efficiency.
C–D compression = proof over promise. Investors price execution risk, margin structure, and defensibility more tightly. Multiples expand again only when burn normalizes, retention strengthens, and sales efficiency holds at scale.
Late-stage recovery = de-risked leaders. E+ names with platform effects, compliance moats, or multi-product attach restore pricing power—even in slower markets.
Operator playbook by stage
Seed: anchor on customer proof points (active design partners, early paid pilots) and a credible bridge to first revenue cohorts.
Series A–B: put NRR, payback, and sales efficiency front and center; highlight cohorts, not just topline.
Series C–D: sharpen path to self-funding growth (gross margin, opex discipline, mix of services); emphasize defensibility (data, workflow lock-in, compliance).
Series E+: show durable economics (net dollar retention, multi-product attach, operating leverage) and credible inorganic options.
With the stage curve mapped, let’s open the hood. Next up: the downloadable Excel—what’s inside, how it aligns with the methodology, and how to slice the 210-company dataset by niche × round × deal type.
Download the Dataset (Excel)
€79.90 · Instant download · 210 companies · 11 niches
With stage dynamics mapped, this is the moment to open the hood. The mid-2025 Excel dataset (€79.90) gives you the full cut behind the benchmarks—pivot-ready and aligned with the methodology above.
What you get
210 companies across 11 niches (12 public, 191 private, 7 M&A), USD-denominated
Ready-made pivots: Niche × Round × Deal Type, plus summary tabs by niche and stage
Clean fields for analysis: Company, Niche, Funding Round, Deal Type, Valuation (EV, $M), Revenue basis (TTM/ARR), EV/Revenue, Total Funding ($M), EV/Funding, Notes/Source
Methodology baked in (anchors flagged; zero-revenue excluded from EV/Rev averages)
Why it’s useful
Founders: set a valuation corridor, pressure-test the story vs. peers, drop charts straight into your deck
Investors: fast comps pull, sanity-check pricing by niche and stage, screen for outliers
Corp Dev: identify premium/discount categories and targets that fit your thesis
How we maintain it
Semi-annual refresh; hotfix for material events (e.g., mega rounds/acquisitions)
Outliers not winsorized; we surface both means and medians in summaries
Summary
This mid-2025 cut benchmarks 210 AI agent companies across 11 niches on EV/Revenue (with EV/Funding as a capital-efficiency cross-check), normalized by stage and deal type.
We frame the market as buyer-driven workstreams to explain why adoption—and pricing—diverge across categories.
The niche benchmarks show clear premium clusters where agents live inside daily workflows with defensibility, while stage dynamics are non-linear: conviction peaks early (A–B), compresses mid-growth (C–D), then rebounds for de-risked leaders (E+).
Strategic Anchors are part of the dataset and the averages; we call out their influence because they set the top-end pricing corridor.
Key Takeaways
Stage curve, not a straight line. Multiples rise from Seed ~22.7x to Series A ~39.1x and Series B ~41.0x, compress at Series C ~26.2x and Series D ~29.3x, then rebound at E+ ~31.7x.
Premium clusters command 30–50x. Dev Tools & Autonomous Coding, Legal & Compliance, and Productivity & Internal Tools earn top-tier pricing where usage is daily, NRR is strong, and moats (data, compliance, workflow lock-in) are evident.
ROI governs the middle band. Marketing & Content Automation, Data & Analytics Agents, and parts of Healthcare & Life Sciences clear in the high-20s to low-30s, with pricing power tied to measurable outcomes and integration depth.
Value clusters face scale friction. PropTech & Real Asset Ops, HR & People Ops, and portions of Sales & Customer Ops average single-digit to low-teens, reflecting services weight, longer cycles, or budget sensitivity unless deeply embedded.
Anchors influence the ceiling. Strategic Anchors (included in the analysis) pull the top end of category averages upward and set reference points for investor expectations, especially in developer- and platform-centric segments.

Answers to The Most Asked Questions
-
There isn’t one number. In mid-2025, AI agent EV/Revenue spans roughly 3–12x (value clusters) to 30–50x (premium niches), varying by niche, funding stage, and revenue quality.
-
Highest pricing concentrates in Dev Tools & Autonomous Coding, Legal & Compliance, and Productivity & Internal Tools, typically 30–50x, driven by daily-workflow usage, defensibility (data/compliance), strong NRR, and efficient payback.
-
Non-linear stage curve: Seed ~22.7x, Series A ~39.1x, Series B peak ~41.0x, Series C ~26.2x, Series D ~29.3x, Series E+ rebounds ~31.7x in our mid-2025 dataset.
-
Premiums come from defensibility (data/compliance), being in the daily workflow, high NRR, and fast payback. Discounts reflect services-heavy deployments, long sales cycles, budget sensitivity, or weak differentiation.
-
Benchmark by niche, stage, and deal type using EV/Revenue and EV/Funding. Compare cohorts, NRR, gross margin, and payback; align milestones to premium drivers before setting a fundraising target.