AdTech Valuation Multiples 2026: Benchmarks Across Public, Private and M&A
This analysis summarizes selected insights drawn from Finro’s AdTech valuation database covering public companies, private growth platforms, and M&A transactions across the advertising technology stack.
AdTech valuation dispersion remains one of the most misunderstood dynamics in today’s tech market. Companies with similar revenue levels can clear at very different multiples, while others with slower growth still command meaningful premiums depending on where value accrues within the stack.
What may look like inconsistent pricing often reflects how investors interpret scale, efficiency, and durability across different segments of the AdTech ecosystem. Similar patterns are visible across adjacent sectors such as AI, cybersecurity, and fintech, where niche positioning and business model design increasingly matter more than headline growth.
Public companies, private growth rounds, and recent M&A transactions are not priced from the same lens. The same revenue figure can signal very different risk profiles depending on distribution control, data ownership, and monetization structure.
Looking at multiples in isolation creates more noise than clarity. Without context around niche, stack position, and stage, headline numbers are easy to misread, a dynamic also seen in broader AI valuation multiples and cybersecurity benchmarks.
For founders preparing to raise, investors benchmarking a deal, or corporate teams evaluating strategic positioning, the dispersion highlighted here changes how valuation conversations are framed in practice.
This analysis focuses on those structural signals. Drawing on a dataset of 170 AdTech companies, it examines how valuation outcomes diverge across public markets, private rounds, and acquisitions, and how execution quality reshapes pricing as companies scale and how investors recalibrate risk across the AdTech stack.

TL;DR
Topics covered in this article
- How Founders and Investors Apply These Multiples?
- Related valuation research and cross-market context
- How this AdTech benchmark is structured?
- Why similar-looking AdTech companies trade at very different valuations?
- How valuation signals diverge across AdTech segments?
- Public markets, private rounds, and M&A reward different things in AdTech
- Benchmarking AdTech valuations: where your company actually sits?
- Summary: What the AdTech valuation data actually shows?
- Key Takeaways
- Answers to The Most Asked Questions
How Founders and Investors Apply These Multiples?
Valuation benchmarks like these rarely sit in isolation. In practice, founders and investors use structured multiples to test fundraising narratives, evaluate strategic options, and align expectations across boards, acquirers, and capital providers.
At Finro, these datasets are integrated into broader valuation advisory engagements, financial models, and M&A positioning work. The objective is not only to reference market ranges, but to understand where a company fits within them — and how shifts in efficiency, growth, and product focus influence valuation outcomes.
Learn more about Finro’s valuation advisory work.
Related valuation research and cross-market context
AdTech valuation dispersion mirrors patterns visible across adjacent technology sectors, where positioning within the stack increasingly drives pricing outcomes.
How this AdTech benchmark is structured?
This analysis is built to reflect how AdTech companies are actually evaluated in the market, not as a single category, but as a layered ecosystem with very different economics.
The dataset brings together public companies, late-stage private platforms, and recent M&A transactions across the AdTech stack.
Rather than focusing on any one segment, it captures demand-side platforms, supply-side infrastructure, data and identity layers, measurement and analytics, creative technology, retail media, mobile monetization, CTV, verification, and performance networks. Each company is assigned to a single primary niche to avoid overlap and double-counting.
To keep comparisons meaningful, all companies are benchmarked using the same valuation lenses. Where available, the analysis relies on enterprise value relative to revenue, EBITDA, and total capital raised.
Public market data is sourced directly from market disclosures, while private company figures and transactions are triangulated from disclosed rounds, reported deal values, and consistent estimation methods. The goal is not precision to the last decimal, but directionally accurate, cross-comparable benchmarks.
Importantly, this benchmark does not attempt to smooth everything into a single market multiple. AdTech spans software-like platforms, media-exposed networks, infrastructure layers, and hybrid models that sit somewhere in between.
Treating them as one group would hide more than it reveals. By structuring the data at the niche level, the analysis allows patterns to emerge naturally, without forcing conclusions.
The result is a dataset designed for practical use: something founders can sanity-check against, investors can reference across stages, and operators can use to understand how similar businesses are being priced today, without relying on anecdote or outdated comps.
Why similar-looking AdTech companies trade at very different valuations?
At a surface level, many AdTech companies look interchangeable.
They sell into the same ad budgets, speak the same performance language, and often operate on both sides of the buy and sell ecosystem.
Valuation outcomes tell a very different story.
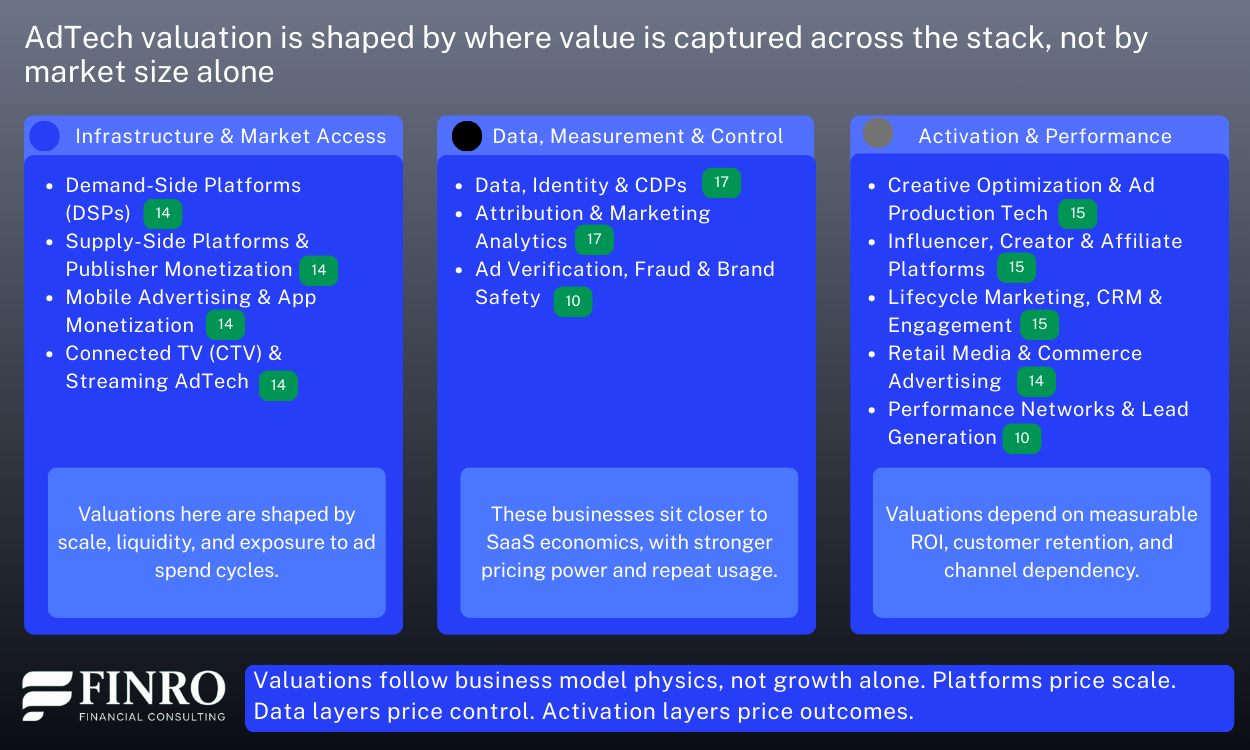
The first driver is where pricing power actually sits.
Market-access platforms such as DSPs, SSPs, mobile ad networks, and CTV infrastructure are primarily valued on scale and liquidity. Public leaders in these segments tend to trade in a relatively narrow revenue multiple band, even when their growth profiles differ materially. Exposure to ad spend cycles and competitive bidding pressure caps upside, regardless of brand strength.
This is why large, well-known platforms with billions in revenue can still trade at single-digit revenue multiples, while smaller companies elsewhere in the stack command meaningfully higher pricing.
The second driver is how defensible the economics are over time.
Data, identity, attribution, and measurement companies behave much closer to SaaS businesses. They monetize control, not volume. In the dataset, companies in these layers consistently trade at higher EV/Revenue ranges than pure execution platforms, especially when revenue is subscription-led and cross-channel.
For example, identity, verification, and analytics providers with recurring contracts and high retention often sustain double-digit revenue multiples even at moderate growth rates. The market prices durability and decision-making influence more than raw ad throughput.
The third driver is whether value is tied to outcomes or activity.
Activation-focused segments such as creative optimization, lifecycle marketing, retail media tooling, and performance networks are increasingly judged on measurable ROI. Companies that can demonstrate repeatable outcomes and strong customer retention tend to outperform peers whose results depend on volatile channels or changing algorithms.
In practice, this creates wide valuation spreads inside the same niche. Two companies with similar revenue can trade multiple turns apart depending on customer concentration, payback periods, and dependency on a single channel.
Across the AdTech stack, valuation is less about what a company does and more about what it controls.
Access layers price scale.
Data layers price control.
Activation layers price outcomes.
That distinction explains why “AdTech multiples” only make sense when viewed through a segmented lens.
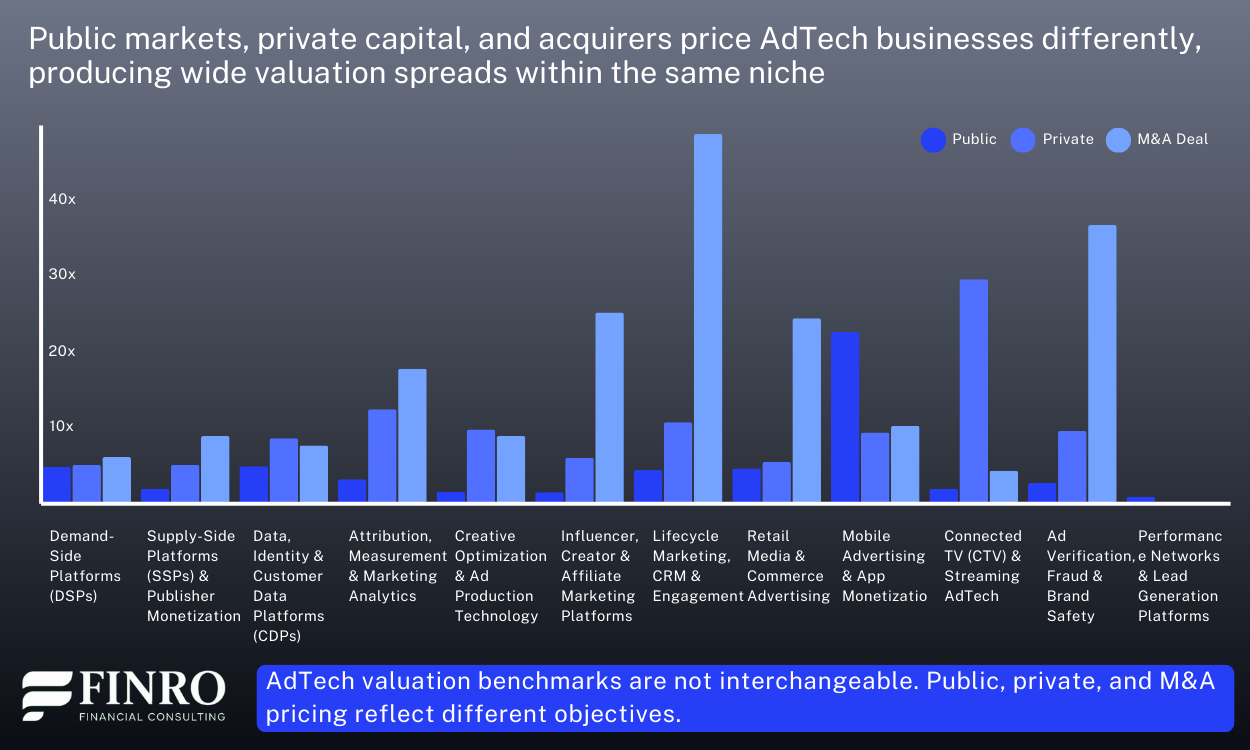
Next, we’ll visualize how these valuation dynamics map across the AdTech stack, and why grouping all AdTech companies under a single benchmark misses the real drivers.
How valuation signals diverge across AdTech segments?
The framework above explains why AdTech companies trade differently.
The data shows how sharply those differences emerge once you look across public markets, private rounds, and M&A outcomes.
Across the dataset, valuation dispersion is not gradual. It is structural. Just as valuation dispersion across stack layers exists in AI, with core infrastructure commanding higher multiples than applied segments, AdTech shows a similar structural divergence.
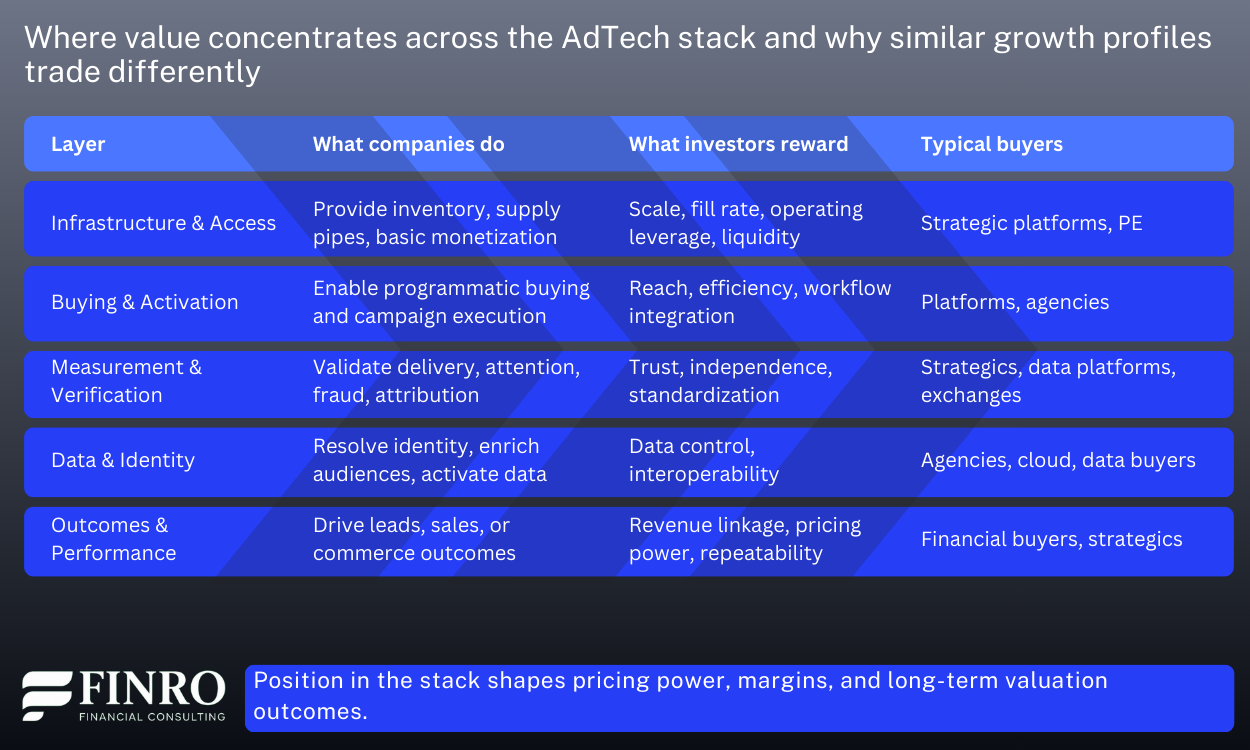
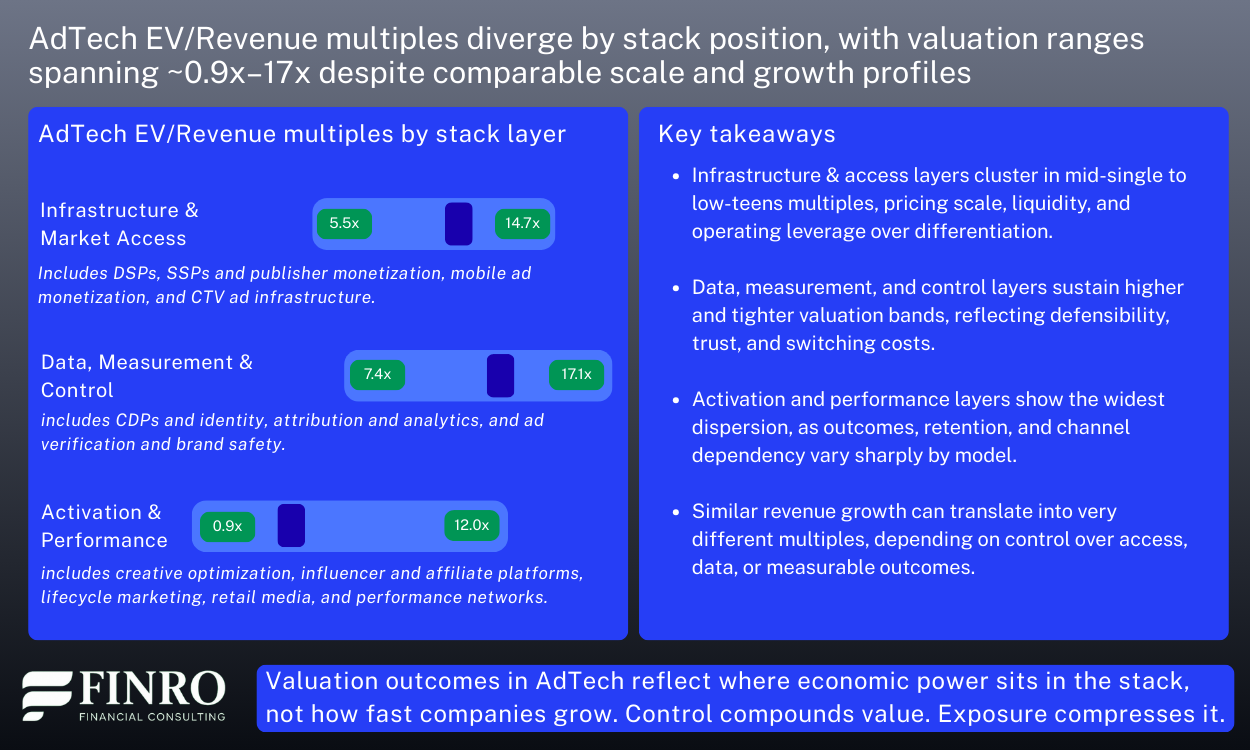
Infrastructure & access: scale still sets the floor
At the infrastructure and market access layer, public comps continue to anchor the upper end of AdTech valuation ranges. Large platforms such as The Trade Desk have historically traded in the high single-digit EV/Revenue range, reflecting scale, liquidity, and deep integration into buyer workflows. Even diversified platforms like Google or Amazon, where advertising is only part of the business, implicitly set valuation reference points by demonstrating how scale and distribution create durable pricing power.
The key insight is not the exact multiple, but the floor: once liquidity, fill rates, and operating leverage are established, valuations compress far less during downturns than elsewhere in the stack.
Data, measurement & control: defensibility over scale
Moving into data, identity, and measurement layers, valuation behavior shifts from scale-driven to defensibility-driven. Public companies such as DoubleVerify and LiveRamp typically trade in the mid-to-high single-digit revenue multiple range, despite materially lower revenue bases than infrastructure players.
In M&A, this dynamic becomes even clearer. Assets like Lotame or Epsilon were acquired at premiums that reflected their role as control points rather than their growth rates. Buyers consistently pay for trust, standardization, and embedded usage, not headline growth.
The result is tighter valuation dispersion and greater resilience across cycles.
Activation & performance: the widest spread
The activation and performance layer shows the most polarized outcomes. Public performance-driven platforms such as Taboola and QuinStreet trade at a low-to-mid single-digit revenue multiple, reflecting exposure to ad spend cycles and traffic dependence. At the other end, platforms with stronger outcome linkage and retention, such as AppLovin, which has traded at double-digit EV/Revenue levels, demonstrate how measurable ROI and pricing power can materially re-rate similar growth profiles.
This is where growth alone fails as a valuation signal. Two companies growing at comparable rates can trade multiple turns apart depending on retention, attribution clarity, and customer concentration.
What the data makes clear
Across public markets and recent acquisitions, similar growth does not lead to similar valuation outcomes. Position in the stack matters more than speed. Control points, repeatability, and revenue linkage consistently outweigh raw expansion.
This is why “average AdTech multiples” are increasingly misleading.
Valuation only becomes comparable once you control for where value is captured and what investors can reliably underwrite.
Next, we’ll visualize how these valuation dynamics map across the AdTech stack, and why grouping all AdTech companies under a single benchmark misses the real drivers.
Public markets, private rounds, and M&A reward different things in AdTech
AdTech valuation outcomes diverge sharply depending on who sets the price and what they optimize for.
Public markets anchor to efficiency and cyclicality.
Across the dataset, publicly traded AdTech companies cluster tightly in the ~3x–8x EV/Revenue range, even at scale. DSPs, SSPs, publisher monetization platforms, and performance networks with $300M–$3B+ in revenue rarely sustain multiples above high single digits. Margin profile and exposure to ad spend cycles dominate pricing.
For example, multiple public AdTech platforms with comparable revenue bases trade anywhere between ~3x and ~6x, driven primarily by EBITDA conversion and volatility rather than growth differentials.
Private markets price optionality and category control.
Late-stage private AdTech rounds consistently clear higher implied multiples. In attribution, identity, lifecycle marketing, and creative optimization, private companies in the dataset commonly price at ~8x–15x EV/Revenue equivalents, despite operating at revenue levels similar to public peers trading at ~4x–7x.
In several cases, private platforms with $50M–$150M in revenue commanded valuations above $1B, implying double-digit revenue multiples based on expectations of future pricing power, data control, or expansion across the stack.
M&A outcomes introduce a third valuation band.
Acquisition multiples vary widely by layer. Infrastructure-heavy and supply-side assets tend to transact closer to public benchmarks, often in the ~3x–7x revenue range, reflecting consolidation and cost synergies.
By contrast, assets tied to measurement, identity, verification, and performance-linked outcomes frequently clear high-single to low-double-digit multiples, even when revenue scale is modest. In the dataset, multiple acquisitions of companies with sub-$100M revenue closed at valuations implying ~10x–20x EV/Revenue, driven by strategic control rather than standalone growth.
The result is a clear but often misunderstood pattern:
Public markets compress AdTech into ~3x–8x bands regardless of narrative
Private rounds stretch outcomes into ~8x–15x+ on future control
M&A pricing spans the widest range, from ~3x to 20x+, depending on strategic leverage
This explains why valuation comparisons across AdTech often appear inconsistent. A company trading at ~5x in public markets can still be acquired at a premium, while a private company priced at ~12x may face material compression once exposed to public market discipline.
The takeaway is simple: multiples only make sense in context. EV/Revenue without market lens, public, private, or M&A, is not a benchmark, it’s a headline.
The chart below illustrates how widely valuation outcomes vary across AdTech niches and market types, without turning those differences into a single benchmark.
Benchmarking AdTech valuations: where your company actually sits?
The charts above show directional truth:
AdTech valuations vary sharply by stack position, business model, and capital context.
But they don’t tell you where your company sits.
To answer that, you need more than averages or public comps.
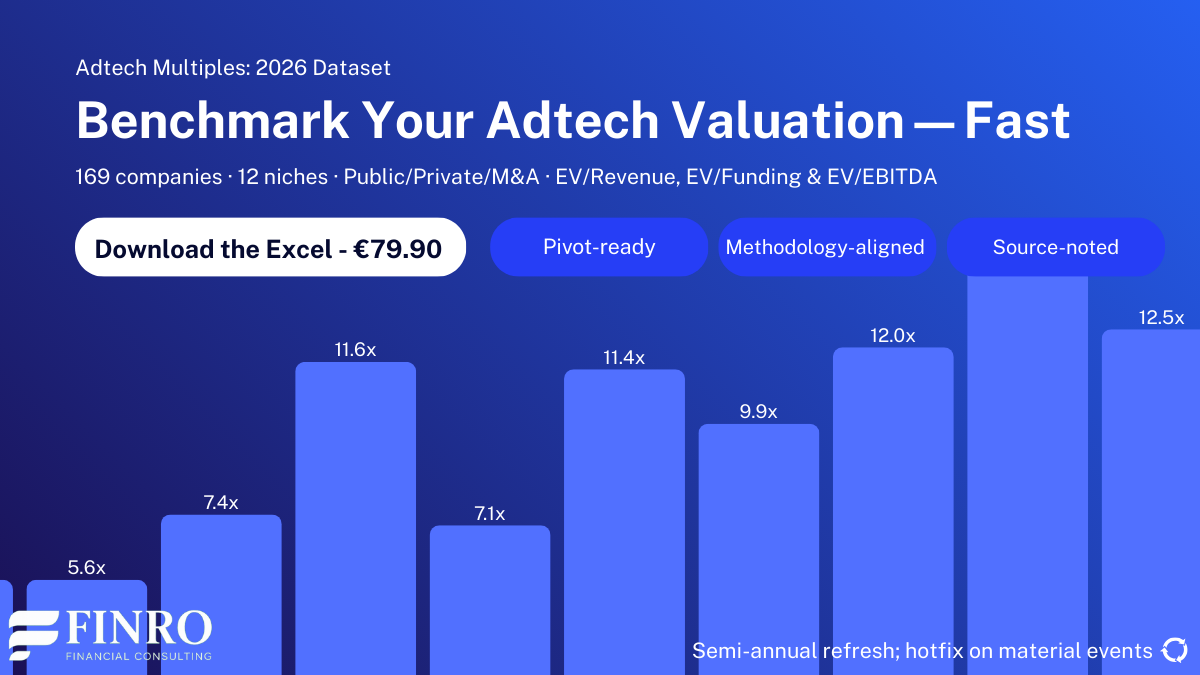
What’s inside the AdTech Multiples 2026 dataset
The full dataset includes 170 AdTech companies, covering 12 niches across the stack, with clean separation between public markets, private rounds, and M&A transactions.
Inside the Excel file:
EV/Revenue, EV/EBITDA, and EV/Funding multiples
Public, private, and M&A deals kept separate: no blended benchmarks
Niche-level and stack-level aggregation
Stage and capital-type visibility (not just headline averages)
Source-linked financials so you can verify every data point
Built for valuation work, fundraising prep, and strategic positioning
This is the same structure we use internally at Finro when advising founders, investors, and acquirers.
Who this is for
Founders preparing for a raise, secondary, or strategic discussion
Investors underwriting AdTech deals across different stack layers
Corporate development teams benchmarking acquisition targets
AdTech operators trying to understand why similar growth trades differently
Download the full dataset
AdTech Valuation Multiples 2026, €79.90
170 companies · 12 niches · Public / Private / M&A · Source-noted
Because in AdTech, valuation outcomes are driven by where you sit in the stack, and generic benchmarks hide that reality.
Summary: What the AdTech valuation data actually shows?
AdTech valuation outcomes are not random, and they are not driven by growth alone. Across 170 companies, the data shows that where value is captured in the stack matters more than how fast revenue grows.
Infrastructure and access layers tend to trade within tighter bands, reflecting scale, liquidity, and operating leverage rather than differentiation. Data, measurement, and control layers command structurally higher and more consistent multiples, driven by trust, switching costs, and defensibility. Activation and performance layers show the widest dispersion, with outcomes highly sensitive to retention, channel dependency, and the durability of measurable ROI.
Public markets, private rounds, and M&A transactions further amplify these differences. Each pricing context reflects a different objective: liquidity and comparability in public comps, forward optionality in private rounds, and strategic or economic fit in acquisitions. Treating these benchmarks as interchangeable masks the real drivers of value.
Taken together, the data reinforces a simple but often missed point: AdTech valuations reflect business model physics, not narrative momentum. Companies with similar revenue profiles can trade at meaningfully different multiples depending on control over access, data, or outcomes, and those gaps persist across cycles.
For founders, investors, and acquirers, the implication is clear: benchmarking only works when it is niche-specific, layer-aware, and context-correct.
Key Takeaways
AdTech valuations are driven more by stack position and control than by revenue scale alone.
Data, identity, and measurement layers consistently command higher and more resilient multiples.
Performance and media-exposed models show the widest valuation dispersion and execution risk.
Public markets, private investors, and acquirers apply fundamentally different valuation lenses.
Benchmarking AdTech companies requires niche-specific, layer-aware, and context-correct comparisons.
Answers to The Most Asked Questions
-
AdTech multiples vary widely by niche and capital context, typically ranging from low single-digit EV/Revenue to double digits for data- and control-driven platforms.
-
Differences stem from stack position, control over data or demand, margin structure, and how exposed the business is to ad spend cycles.
-
Public markets emphasize liquidity and predictability, while private rounds price optionality, often resulting in higher but less stable valuation multiples.
-
Often yes, especially when acquisitions deliver strategic control, proprietary data, or integration synergies that are not reflected in public trading multiples.
-
Founders should benchmark against companies in the same niche, stack layer, stage, and capital context rather than relying on blended or headline market averages.