
Fintech Infrastructure vs Applications: A Tale of Two Valuation Markets
Founder of Finro Financial Consulting. Personally leads every valuation, modeling, and M&A advisory engagement.
View Lior's profile →Startup valuation, financial modeling, and M&A advisory for AI, fintech, and SaaS companies. Serving funded tech startups from pre-seed through pre-IPO.
About Finro →This analysis draws on Finro’s Mid-2025 fintech valuation database covering public comps, private rounds, and M&A benchmarks across infrastructure and application segments.
Fintech once behaved like a single category: payments, lending, neobanks, APIs, compliance tools, and wealth platforms grouped under one umbrella.
But the market has changed, and the data shows a clear pattern: fintech is evolving into two very different markets with very different valuation profiles. Similar structural splits are visible across adjacent sectors such as AI, API-as-a-Service, and cybersecurity, where positioning within the stack increasingly drives valuation outcomes.
On one side are fintech infrastructure companies: the rails, APIs, risk engines, KYC/AML providers, treasury systems, and payment orchestration layers that power the industry behind the scenes.
Investors increasingly treat these businesses like SaaS or API-as-a-Service: sticky, scalable, high-margin, and predictable. They often command higher revenue multiples because their economics look closer to infrastructure software than consumer apps.
On the other side are fintech applications: neobanks, lending platforms, personal finance apps, SMB finance tools, embedded finance wrappers, and wealth management offerings.
These companies push value directly to the end user, but they also carry the vulnerabilities of consumer-facing businesses: higher CAC, more regulation, lower switching costs, and greater sensitivity to marketing budgets. Their valuation multiples behave very differently from their infrastructure counterparts.
In our mid-2025 dataset, this split becomes unmistakable. Instead of one unified fintech market, we now see two parallel tracks: one where efficiency compounds and margins expand, and another where growth requires more capital and multiples respond more slowly.
Understanding where your startup fits, infrastructure or application, matters more today than ever before. Investors are no longer pricing fintech as a single narrative. They are underwriting distinct revenue engines with different risk profiles, growth mechanics, and margin trajectories.
This article breaks down why that gap is widening, what drives valuation multiples on each side, and how founders can use this shift to position their companies more effectively for investors.
TL;DR
Topics covered in this article
- What Defines Fintech Infrastructure vs. Fintech Applications?
- Why These Two Markets Produce Different Valuation Multiples?
- The Multiples Tell the Story: What the Mid-2025 Data Shows
- The Hidden Drivers Behind Each Fintech Segment’s Valuation
- How Founders and Investors Apply These Multiples?
- Related Fintech valuation research and market context
- How Founders Should Use Valuation Multiples in Fundraising and Strategy?
- Explore the Full Mid-2025 Fintech Multiples Dataset
- Summary
- Key Takeaways
- Answers to The Most Asked Questions
What Defines Fintech Infrastructure vs. Fintech Applications?
As fintech matures, the distinction between infrastructure and applications becomes clearer.
These two groups solve different problems, use different business models, and generate very different economic results. Understanding this split is the foundation for understanding why their valuation multiples diverge.
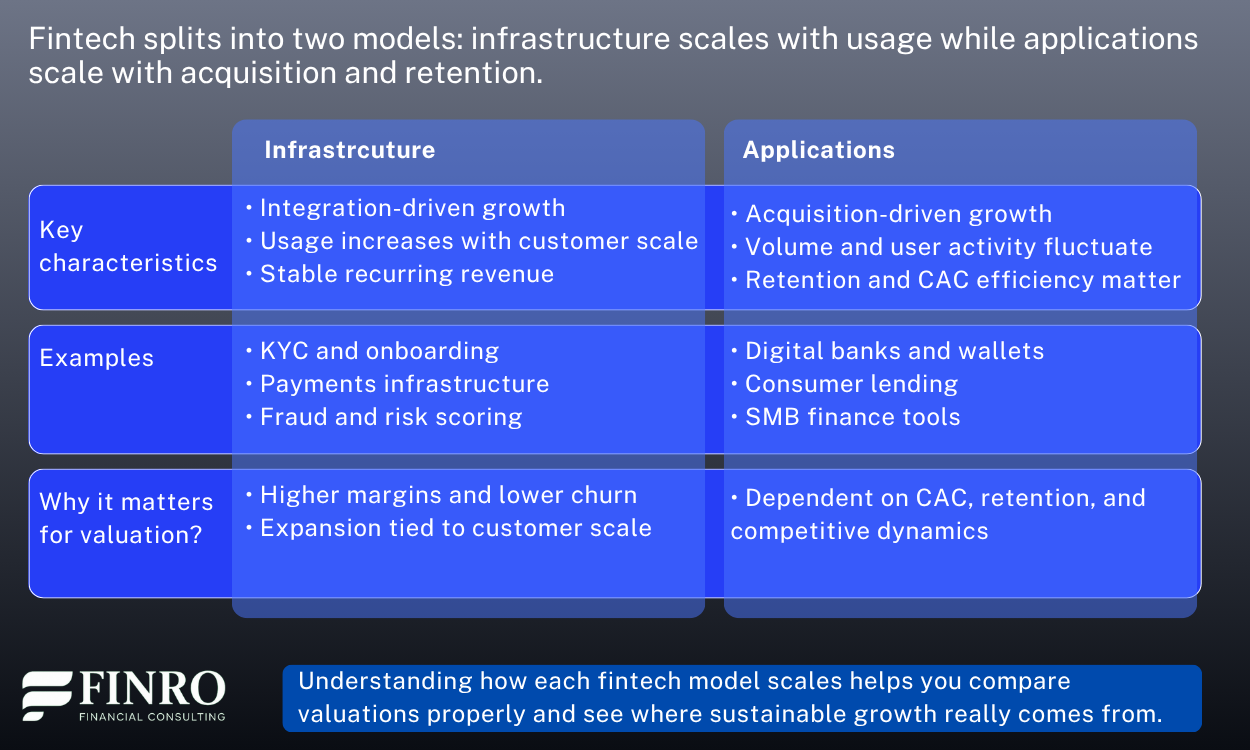
Fintech Infrastructure: The Rails, Engines, and APIs Behind the Industry
Infrastructure companies provide the underlying technology that other fintechs, SaaS platforms, marketplaces, and financial institutions depend on.
Their products operate deep in the stack: identity verification, fraud prevention, payment orchestration, developer APIs, treasury rails, AML monitoring, data enrichment, real-time risk scoring, and compliance automation.
These businesses grow through integration-driven adoption. Once they sit inside a customer’s workflow or tech stack, replacing them becomes expensive and risky. That stickiness creates predictable recurring revenue, strong net retention, high gross margins, and very low churn. Infrastructure often expands usage as customers grow, which makes their revenue scale more like SaaS than consumer fintech.
Fintech Applications: The Products End Users Touch
Application-layer fintech companies deliver financial services or financial experiences directly to consumers or businesses. Neobanks, lending platforms, wallets, wealthtech apps, expense management tools, and SMB finance solutions live here.
These companies compete on interface, brand, and consumer trust — which means acquisition costs matter more, churn occurs faster, and customer loyalty is harder to defend.
Their revenue models are diverse: interchange, lending, subscriptions, referral fees, or transaction volume. But most share a common challenge: they are exposed to the economics of distribution. CAC rises as markets saturate, retention fluctuates with customer behavior, and margins depend on external rails like banks or card networks.
As a result, investors evaluate application fintech companies more like marketplaces or direct-to-consumer businesses than software infrastructure.
Why This Distinction Matters for Valuation
Infrastructure and application companies operate in the same industry, but their business models pull their valuation multiples in different directions. One side compounds with each integration. The other must repeatedly win customers back.
This structural difference sits behind many of the patterns we see in the mid-2025 data and helps explain why fintech now behaves more like two separate markets than one unified category.
Why These Two Markets Produce Different Valuation Multiples?
In the previous section, we broke fintech into two distinct engines of growth: infrastructure, which scales with customer usage, and applications, which scale with acquisition and retention.
Understanding that split is the key to understanding why valuation multiples in fintech vary so widely. Investors aren’t just pricing revenue, they’re pricing the quality and scalability of that revenue.
Infrastructure fintech companies benefit from usage-driven expansion that requires little additional cost. Once a system is integrated into a customer’s workflow, it becomes sticky, durable, and additive as the customer grows.
This is why companies like Adyen, Stripe, and Marqeta consistently command higher valuation multiples. Adyen has traded in the 14x–20x revenue range during strong growth cycles, and even when growth moderates, usage-linked platforms like Marqeta still hold 7x–10x multiples.
In private markets, infrastructure players such as Plaid, Unit, and TabaPay often raise at valuations that reflect their long-term expansion potential — every new integration increases lifetime value without proportionally increasing operating costs. Investors reward this compounding effect.
Application-focused fintech companies experience a different reality. Their growth is tied to customer acquisition, engagement, and retention, all variables with higher volatility and direct dependence on sales and marketing efficiency.
As a result, their multiples tend to sit much lower. Public markets show this clearly: SoFi, Upstart, and MoneyLion typically trade in the 3x–6x revenue range.
During periods of higher credit risk or weaker loan performance, companies like Upstart have compressed closer to 2x–3x. Even high-quality consumer-facing apps and SMB finance tools often land between 2x and 4x, reflecting greater churn, more price competition, and higher CAC pressure.
In private markets, many lending and digital banking models raise at more modest valuation caps because their revenue doesn’t scale automatically with user growth.
The contrast is structural — not situational.
Infrastructure grows when customers grow; applications grow when marketing works.
Infrastructure compounds through workflow lock-in; applications compound only when acquisition, retention, and product differentiation all align.
Infrastructure gains efficiency with scale; applications gain efficiency only when CAC and churn remain under control.
This is why two fintech companies with identical revenue can have completely different valuation multiples. One is built on durable usage economics; the other is built on customer behavior that must be continually earned.
Once you see the difference, you also see the path forward: understand which model you operate in, and then lean into the forces that make your revenue more predictable, more defensible, and more scalable.
The Multiples Tell the Story: What the Mid-2025 Data Shows
Once you understand the two underlying models driving fintech growth — infrastructure and applications — the valuation differences in the mid-2025 dataset begin to make perfect sense. The data doesn’t just show numbers; it reflects the economics, product architecture, and business mechanics behind each company.
Across the dataset, infrastructure fintech consistently commands higher revenue multiples, often ranging between 12–20x, with standout cases reaching 25–30x when usage growth and enterprise adoption compound.
Companies like Stripe (infrastructure components), Adyen, and Marqeta illustrate this dynamic: their recurring transaction throughput, high margins, and deep workflow integration allow revenue to scale faster than costs.
Application fintech, on the other hand, shows more variability, with many companies falling into the 5–12x range. This includes digital banking apps, consumer credit products, SMB finance tools, and personal financial management platforms.
Even strong performers such as Wise or Affirm see lower multiples compared to infrastructure-heavy peers because their revenue scales with user activity, churn risk, and acquisition efficiency — all of which introduce volatility.
In mid-2025, the dataset highlights a clear pattern:
companies with usage-based revenue tied to customer scale (like payments infrastructure, onboarding/KYC platforms, fraud scoring engines, and core connectivity APIs) earn the most premium multiples. Meanwhile, companies that depend on acquisition, consumer volume, or engagement cycles show wider variance, reflecting both upside and instability.
These differences are not theoretical — they appear in every slice of the data. Infrastructure startups exhibit median gross margins between 65–80%, lower churn, and predictable expansion revenue. Applications display margins in the 40–70% range but see bigger swings in churn, CAC pressure, and retention.
By reading multiples through the lens of business model mechanics, founders gain a more accurate understanding of how investors interpret their trajectory and how valuations are justified.
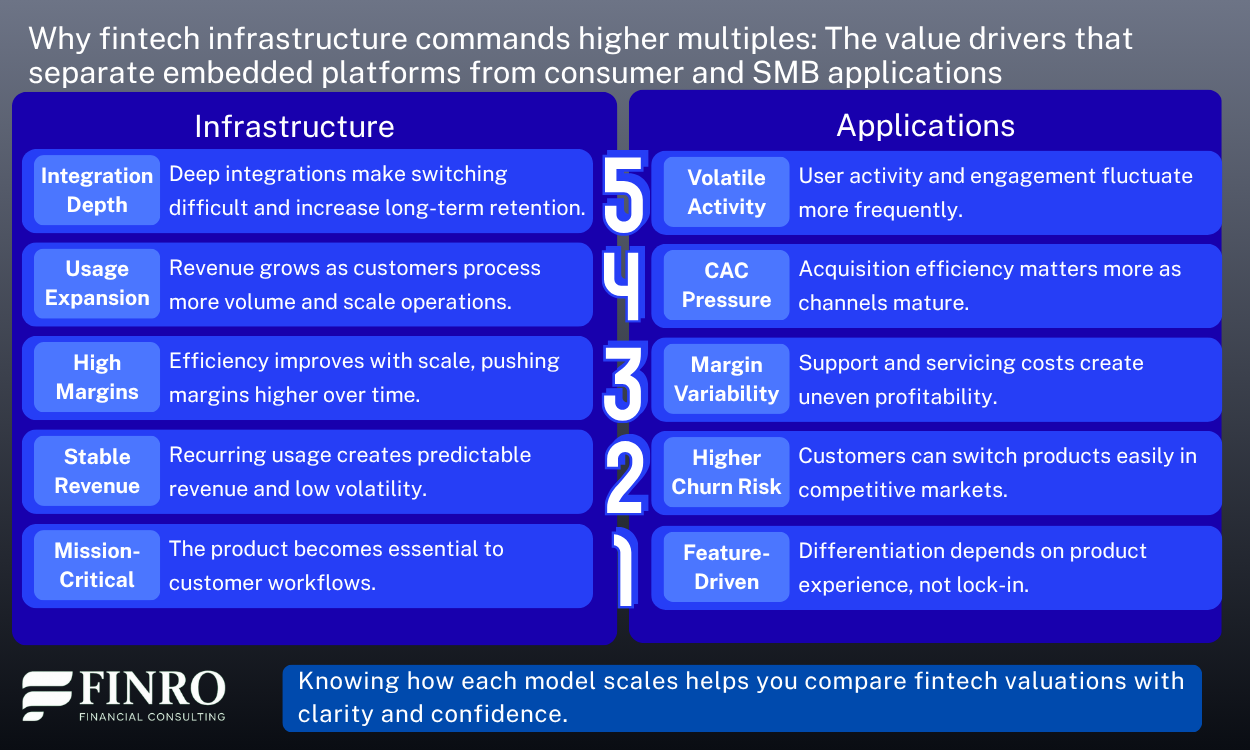
The Hidden Drivers Behind Each Fintech Segment’s Valuation
Now that the differences in multiples are clear, the next question is why certain niches consistently price higher than others. The answer sits in a handful of underlying economic drivers that shape how revenue behaves, how sticky customers are, and how efficiently each additional dollar scales. These factors are not always visible on the surface, but they are exactly what investors examine when comparing one fintech category to another.
Some niches benefit from structural tailwinds that make their revenue inherently more predictable. Payments infrastructure, onboarding and KYC platforms, fraud-scoring engines, and connectivity APIs scale through usage rather than acquisition.
Their customers integrate them deeply into workflows, which naturally drives retention and expansion. This is also why their margins often improve with scale. Once the core infrastructure is built, incremental costs fall, and every additional customer contributes more profit than the one before.
Other segments rely more heavily on consumer or SMB behavior, which introduces more variability. Digital banks, lending platforms, personal finance tools, and many credit-driven applications depend on activity, engagement, or risk cycles.
These companies may enjoy periods of rapid growth, but they also carry higher exposure to churn, CAC inflation, regulatory shifts, and margin pressure. Even strong companies in these categories show wider swings in revenue quality from quarter to quarter, which leads to broader valuation ranges.
There are also hybrid categories that borrow elements from both models. Wealthtech platforms, insurtech businesses, regtech providers, and SMB financial tools often enjoy solid retention and decent margins, yet they do not scale with the same usage-driven acceleration that lifts pure infrastructure multiples.
Their revenue grows steadily, but it usually tracks customer count more directly than customer volume, which keeps multiples moderate even when fundamentals are strong.
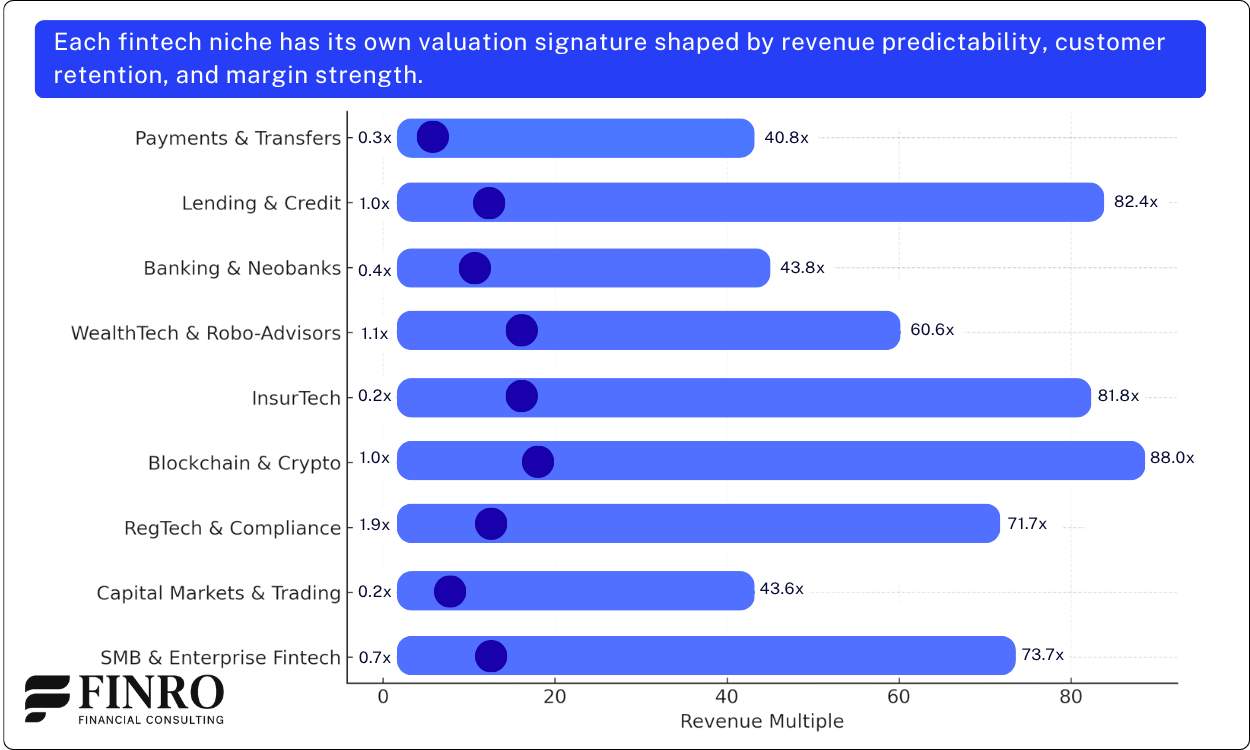
What these differences reveal is simple. Every fintech niche has a distinct economic signature made up of margin profile, customer dependency, retention patterns, revenue predictability, and the strength of unit economics. Investors do not reward growth alone.
They reward the specific combination of growth and durability that defines each segment. When founders understand these underlying drivers, they gain a clearer sense of where their valuation sits today and what levers will move it upward over time.

How Founders and Investors Apply These Multiples?
Valuation benchmarks like these rarely sit in isolation. In practice, founders and investors use structured multiples to frame fundraising narratives, evaluate platform positioning, and benchmark strategic outcomes across infrastructure layers.
At Finro, these datasets are typically integrated into broader valuation advisory engagements, financial models, and M&A positioning work. The objective is not only to reference market ranges, but to understand where a company fits within them, and how shifts in efficiency, distribution, and monetization design influence valuation outcomes.
Learn more about Finro’s valuation advisory work.
How Founders Should Use Valuation Multiples in Fundraising and Strategy?
You’ve seen how different fintech niches behave, how their multiples move, and which business models command a premium. Now the question becomes practical: What should a founder actually do with all of this? Multiples are not academic. They shape investor expectations, signal what “good” looks like in your category, and influence how you position your company when you raise.
Multiples are not your valuation. They are benchmarks that help you understand where you stand in the market and how your fundamentals compare to other companies with a similar product, audience, and revenue engine. When used correctly, they become a strategic tool rather than a scoreboard.
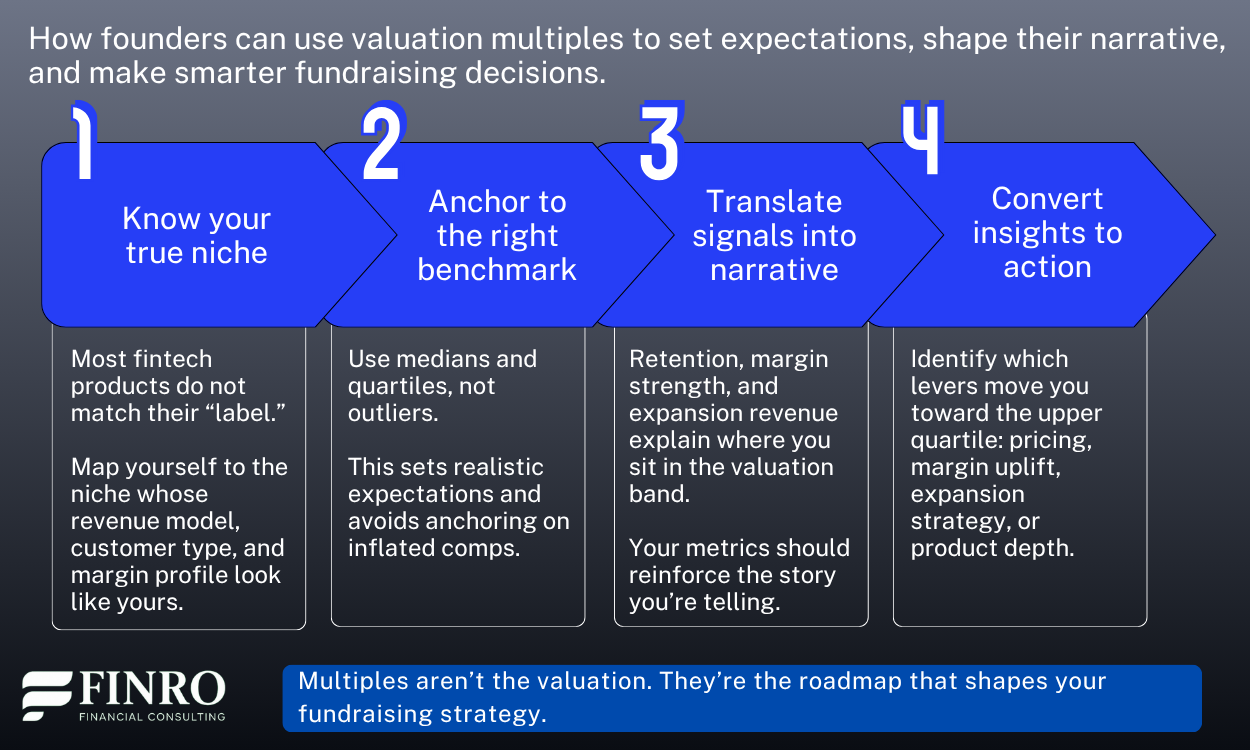
The first step is to identify the niche that truly reflects how your business operates. A company offering cross-border payouts should not pitch itself like a neobank, and a fraud-prevention API should not benchmark against SMB lending platforms.
Each niche carries its own valuation signature, shaped by retention, revenue predictability, margin structure, capital intensity, and competitive pressure. Once you anchor yourself in the right peer group, everything else becomes clearer.
The second step is interpretation. Outliers should inspire, not anchor your expectations. Infrastructure platforms with durable revenue and net retention above 120 percent earn materially higher multiples than consumer-facing applications with churn in the high teens.
Enterprise compliance tools with strong gross margins sit in a different band than capital-heavy lending products. When founders compare themselves to the right cluster — by stage, business model, and revenue quality — the valuation conversation becomes more grounded.
The third step is application. Multiples help you shape your fundraising narrative with facts rather than wishful thinking. If your niche’s mid-2025 median EV/Revenue is 6.2x and the top quartile lifts above 12x, you can position your traction relative to these benchmarks and explain why you land where you do.
If your retention or margins beat the category, say it. If you are early but trending toward the profile of the higher-multiple bands, highlight the slope, not just the current number. Investors respond to patterns.
Finally, the dataset is not only for external positioning. It can guide internal decisions. If you notice that the highest-multiple companies in your niche have lower cost to serve, stronger expansion revenue, or deeper product stickiness, those become near-term priorities.
If you’re outperforming your category on retention but lagging on margin, you know what to fix. The data gives founders a way to convert market signals into operational focus.
Used well, valuation multiples help founders tell a sharper story, set more accurate expectations, and build a plan that aligns with how the market rewards performance.
They turn the fundraising conversation from “What valuation can we get?” into “Here’s the evidence for the valuation we deserve.”
Explore the Full Mid-2025 Fintech Multiples Dataset
Suppose you want to go beyond high-level patterns and understand what truly drives valuation across fintech. In that case, the full Mid-2025 Fintech Valuation Multiples Dataset provides a much clearer and more comprehensive view.
It covers 360 companies across nine fintech niches, including Payments, Lending, Banking & Neobanks, Wealthtech, Insurtech, Crypto & Digital Assets, Capital Markets Tech, Embedded Finance, and Fintech Infrastructure. Each niche includes median and upper-quartile revenue multiples, identifiable patterns, and the valuation signatures unique to that segment.
For founders, this level of detail makes it easier to anchor expectations and prepare a grounded fundraising narrative. You can see exactly where your niche sits, how far you are from the upper quartile, and which metrics matter most to justify a higher multiple. You also get clarity on where your business model fits: whether you behave more like infrastructure, a product-led fintech, a financial platform, or a transactional volume-driven business.
For operators and finance teams, the dataset offers tangible benchmarks for planning and forecasting. It helps with pricing decisions, growth modeling, margin targets, and even board communication. Instead of referencing broad industry commentary, you can benchmark against companies with similar revenue mechanics and customer profiles.
For investors, advisors, and analysts, the dataset streamlines diligence by showing how valuation ranges have shifted through 2025 and which niches are strengthening or compressing. You can compare any fintech company against a structured dataset rather than a scattered set of market anecdotes.
If you want to explore the data in depth, the full dataset is available for download and gives you a transparent view of all nine niches and the 360 companies included. It is a practical tool for anyone who wants to understand what is actually happening beneath the surface of fintech valuations in 2025.

Summary
Fintech valuations diverge far more widely than most founders expect, and the gap has only grown through mid-2025. What looks like a single category from the outside is actually a collection of distinct markets, each with its own economics, revenue mechanics, risk profile, and customer behaviour.
Payments, lending, wealthtech, neobanks, infrastructure platforms, embedded finance, digital assets, insurtech, and capital-markets technology do not follow the same rules, and the data makes this clear. The companies that consistently achieve higher revenue multiples are those with deeper retention, stronger margin leverage, and more predictable recurring revenue streams — not simply those with faster top-line growth.
Across the 360 companies included in the Mid-2025 Fintech Multiples Dataset, the same pattern repeats: business models built on infrastructure, data, orchestration, or workflow automation command meaningfully higher valuation ranges than consumer or SMB-facing applications. Meanwhile, niches that depend on variable transaction volumes or heavy servicing cost structures tend to anchor toward the median.
These differences are structural, not anecdotal, and they explain why companies with similar revenue levels can receive valuation multiples that differ by three to five times. Understanding where your product fits is no longer optional; it is now a core part of strategic and fundraising planning.
For founders, operators, and finance teams, the takeaway is straightforward. Valuation is not determined by a market mood or a round label. It flows from the mechanics of your revenue, your margin profile, your expansion engine, and your ability to retain and compound value over time.
By grounding expectations in the real economics of your niche and identifying the levers that move you toward the upper quartile — whether pricing, product depth, margin efficiency, or customer quality — you build a clearer, more credible narrative for investors and a stronger roadmap for long-term growth.
At Finro, we help startups articulate that narrative, benchmark their performance, and translate complex market data into investor-ready insights. If you want to understand where your company sits, what drives your valuation, and how to position your next round, the full dataset and our valuation support can help you get there.

Key Takeaways
Valuation differences are structural: Fintech niches behave differently due to revenue quality, margin depth, and customer durability, which drive significant divergence in revenue multiples.
Infrastructure commands the highest multiples: Platforms embedded in customer workflows earn premium valuation ranges because of stable revenue, high NRR, and strong margin leverage.
Applications follow median patterns: Consumer and SMB-facing fintech products anchor around the middle due to higher churn, lower margins, and more variable transaction volumes.
Multiples reflect revenue durability: Retention, expansion, and long-term margin potential explain why similar revenue levels can receive very different valuation outcomes.
Benchmarks guide strategy: Using niche-specific multiples helps founders set realistic targets, shape fundraising narratives, and identify levers that move them toward the upper quartile.
Answers to The Most Asked Questions
-
Different niches have different economics. Payments, lending, wealthtech, neobanks, and infrastructure each carry unique risk, margin, and retention profiles that shape their valuation ranges.
-
Infrastructure, orchestration, data, and embedded finance earn the highest multiples because they deliver recurring value, show strong margin leverage, and have deep customer integration.
-
Improved retention, stronger expansion revenue, higher gross margins, and a more durable revenue engine. Investor confidence increases when revenue becomes predictable and capital-efficient.
-
Start with niche medians, compare your metrics to top quartile performance, and build a narrative around the levers that justify your place in the valuation band.
-
The complete Finro dataset covers 360 fintech companies across nine verticals, providing detailed median and upper-quartile revenue multiples for each niche.