
Customer Churn Rate: The Metric That Defines Retention, Product Strength, and Growth Quality
By Lior Ronen | Founder, Finro Financial Consulting
Every startup loves to talk about growth.
New users, new logos, new MRR milestones.
But the truth is that growth without retention is a mirage. If customers leave faster than you replace them, the business isn’t growing—it’s leaking.
Churn exposes what marketing numbers often hide. It shows whether users find ongoing value, whether your product fits into their workflow, and whether you’re building something sticky enough to scale sustainably.
For investors, churn is one of the most revealing signals of product strength and market maturity.
A startup can raise capital with high growth. It earns long-term trust by keeping customers. Understanding churn, tracking it correctly, and reducing it methodically are what separate real traction from temporary spikes.
Next, let’s define what churn actually measures and how to calculate it in a way that reflects business reality, not just a surface metric.
Sustainable growth depends on how well a product becomes part of a user’s routine and continues to deliver value over time. Strong retention reflects alignment between expectation and experience, supported by an onboarding flow that leads to early meaningful outcomes, workflows that encourage repetition, and communication that reinforces the value being delivered. Companies that understand and respond to churn signals mature faster, scale with less capital, and build more defensible market positions.
What Is Customer Churn Rate (and How to Calculate It)?
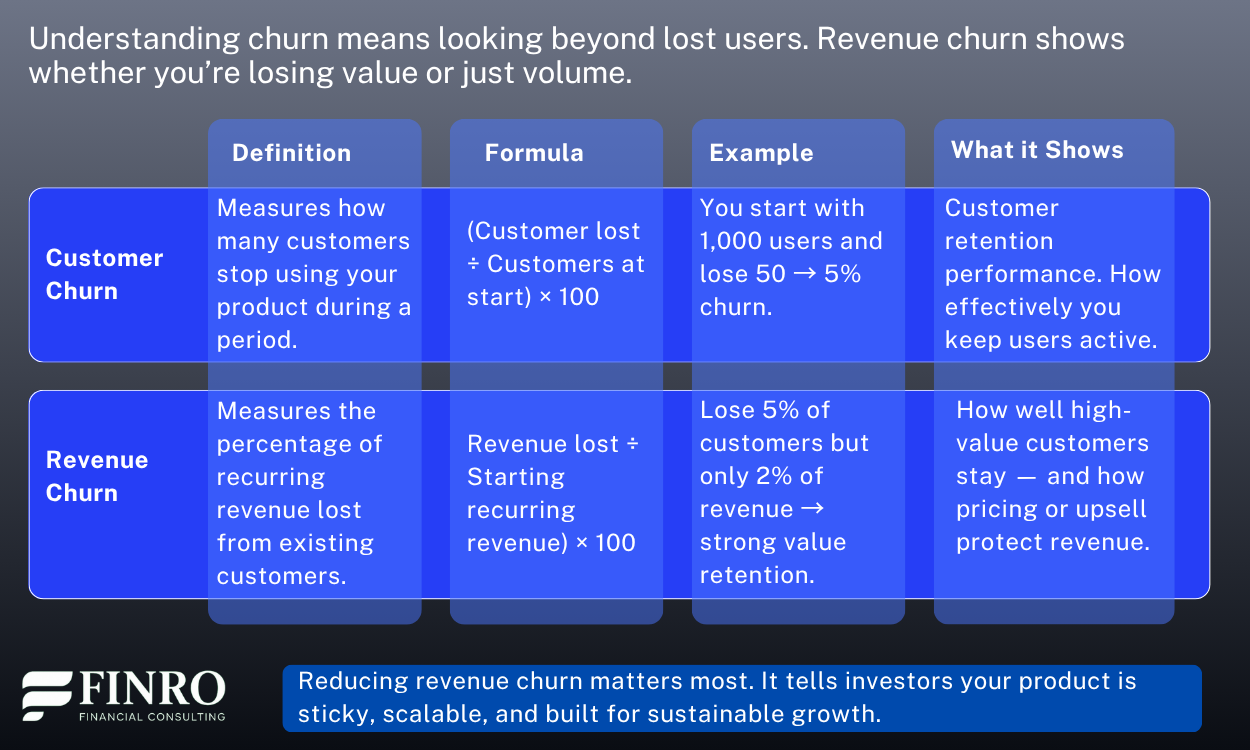
Customer churn rate measures the percentage of customers who stop using your product within a given period.
It’s one of the simplest yet most revealing startup metrics because it shows how effectively you retain the users you’ve already paid to acquire.
The basic formula is:
Churn Rate = (Customers lost during a period ÷ Customers at the start of the period) × 100
For example, if you start a month with 1,000 customers and lose 50, your churn rate is 5%. If you start the next month with 950 and lose another 50, churn jumps to 5.3%. The smaller your base becomes, the heavier every lost customer weighs.
Startups can track customer churn (number of users lost) or revenue churn (recurring revenue lost). The distinction matters: a SaaS startup might lose 5% of customers but only 2% of revenue if the ones leaving were low-value accounts.
The time frame also changes the interpretation. Monthly churn highlights short-term retention issues, while annual churn helps assess product stickiness over time. For early-stage founders, tracking both gives a clearer view of whether customers are leaving due to poor onboarding or low long-term value.
Here’s a quick real-world example:
A fintech startup starts the quarter with 2,000 paying users. By the end of the quarter, 180 users have churned.
Churn Rate = (180 ÷ 2,000) × 100 = 9%.
If those users accounted for only 4% of total revenue, that means the company’s high-value customers are staying in — but its low-value users aren’t converting well.
Understanding these nuances is key before you start improving churn, because how you calculate it determines what you’ll fix.
How Robust Is Your Financial Model?
Before showing your model to investors, it is worth asking a few simple questions.
- Can every revenue assumption be traced to a real acquisition channel or pricing driver?
- Do CAC and retention assumptions reflect realistic scaling dynamics?
- Do margins expand because of operational changes — not just spreadsheet logic?
- Does the hiring plan match the company's ability to acquire and serve customers?
- Can the model clearly explain capital needs and runway under different scenarios?
If any of these questions are difficult to answer, the model may benefit from an external review before investor discussions begin.
See How the Financial Model Review WorksHow to Interpret Churn: What Investors Actually Look At?
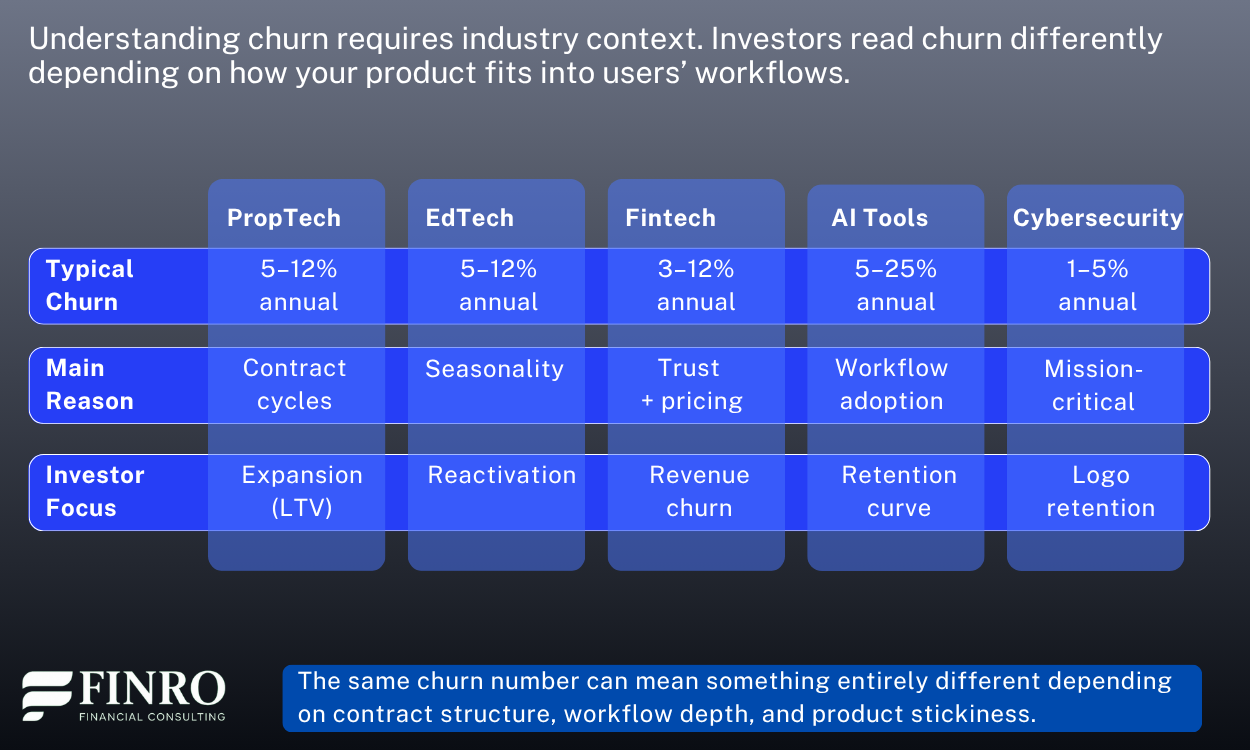
Churn tells a story that goes far beyond a single percentage. Investors don’t just care how many customers you lose. They care who leaves, how fast, and what that says about your product’s value loop. A 3% monthly churn rate might look healthy on paper, but it means something very different for a PropTech startup selling enterprise contracts than for an AI tool with self-serve monthly users.
In EdTech, for instance, churn often reflects seasonality. Students or professionals complete a course, pause their subscription, and return later for new content. An investor who understands this dynamic focuses less on short-term churn and more on reactivation rate — the percentage of users who come back within a few months.
In contrast, Fintech platforms dealing with payments or lending face structural churn risk when user trust wavers. Here, even small churn upticks can signal deep issues in reliability, compliance, or cost-to-serve.
AI startups tend to experience early volatility in churn because users experiment heavily with different tools before finding real utility. What matters to investors is not the initial churn, but the retention curve — whether usage stabilizes after the first few months.
Cybersecurity companies, on the other hand, are expected to show exceptionally low churn. Once a product integrates into enterprise systems, replacing it becomes costly and risky. For them, a 2–3% annual churn can already raise questions about product fit or renewal execution.
Ultimately, investors use churn to evaluate defensibility. A low churn rate backed by strong gross margins and recurring contracts signals predictable growth and efficient capital use. A higher churn rate paired with rising acquisition costs tells the opposite story — that each customer is more expensive to win and easier to lose.
Churn, in other words, is not just a retention metric. It’s a measure of trust, stickiness, and operational maturity.
How to Reduce Churn: Practical Levers That Actually Work
Improving churn does not start with discounts, promotions, or last-minute save campaigns. It starts much earlier in the user journey. Churn is usually the result of a mismatch between expectation and experience.
When users expect one outcome and the product repeatedly delivers something weaker, they leave. Reducing churn means closing that gap.
The first place to look is onboarding. Most churn happens in the first 14 to 45 days, when users are still forming habits. If early activation is slow, confusing, or dependent on manual workflows, users disengage before they ever see value.
In EdTech, a course platform that guides a learner into their first module with clear progress cues keeps retention significantly higher than one that drops users into a full library with no path.
The same logic holds in AI tools: when users experience a quick “win” within minutes, retention curves flatten early and remain strong.
Next is product stickiness, which is shaped by how deeply the product becomes part of a workflow. In PropTech, integrations with property management software reduce churn because the product becomes embedded into daily operations.
In Fintech, automated reconciliation or compliance monitoring keeps teams from switching because the product reduces operational risk. Stickiness is not a feature. It is the removal of switching friction.
Then comes value reinforcement. Even if the product is working, users forget the benefit unless they are reminded.
Cybersecurity companies excel here: monthly risk-reduction reports show ROI in a concrete way. AI infrastructure platforms often send usage summaries highlighting cost savings or time saved. Communicating value is as important as delivering it.
Finally, churn reduction requires closing the feedback loop. When users leave, the reason needs to be captured, analyzed, and acted on systematically. High-growth teams do not fear churn data. They treat it as a product roadmap signal.
Too many founders assume churn is marketing or pricing. Often, it is messaging, onboarding, or unclear value paths.
Reducing churn is not about keeping people from leaving. It’s about making the product worth staying for, every week, without persuasion.

Churn Over Time: How It Changes as You Scale
Churn is not a fixed number. It changes as your product, market, and customer base mature. Early-stage churn often looks high because users are still experimenting, trying alternatives, or learning whether the product fits their workflow.
What matters most at this stage is whether your retention curve stabilizes after the first few weeks or months. A sharp initial drop followed by a steady plateau is normal and healthy for young companies.
As the product matures, churn becomes less about onboarding and more about value depth. In EdTech, churn often settles once content pathways and progress cues are well designed. In Fintech, churn drops once trust and reliability are proven.
In AI tools, churn declines when the product becomes part of a repeating workflow, not just an occasional utility. In Cybersecurity, churn is expected to remain low from the beginning because the product is embedded in critical infrastructure where switching creates operational risk.
Later-stage churn reflects the strength of the relationship, not just the strength of the feature set. Renewals, account management, and ongoing value reinforcement drive the numbers more than signup flows. At this point, churn is also heavily influenced by product breadth. Companies that expand into adjacent features or categories reduce churn because the product touches more parts of the customer’s daily system.
This is why investors do not read churn as a single percentage. They read the shape of the retention curve. A startup that loses many users early but keeps the remaining ones for years shows healthy product-market fit.
A company with a flat retention curve from the beginning signals a product that is deeply embedded and defensible. A constantly declining curve, at any stage, is a sign that the product does not hold long-term value or that the market is more competitive than expected.
Churn is not just what leaves. It is a reflection of how well your product becomes a habit and how strongly it holds its place over time.

Summary
Churn is more than a retention metric. It is a signal of how deeply your product fits into a customer’s workflow and how consistently it delivers value. Understanding churn requires looking at both the number of customers leaving and the revenue associated with them.
A company can lose many small accounts and still be strong, while losing a small number of high-value accounts can indicate a structural issue. This is why investors focus on revenue churn and retention curves more than a single churn percentage.
Churn behaves differently across product categories. PropTech and Cybersecurity benefit from longer contracts and deeper integrations, while AI tools and EdTech often see higher early churn as users discover whether the product fits their needs.
What matters is not initial volatility, but how churn stabilizes as the customer relationship develops. When onboarding leads to rapid value, workflows create routine use, and value is reinforced over time, churn decreases and retention compounds.
Reducing churn is not about preventing customers from leaving. It is about creating a product experience that is consistently worth staying for. The most resilient startups treat churn data as input to product design, onboarding sequencing, and lifecycle communication.
When the product reinforces value continuously, customers stay, expand, and become advocates — and the business scales with far greater capital efficiency.
Key Takeaways
Retention shows real product value. Growth is fragile without it.
Customer churn and revenue churn tell different stories. Revenue churn reflects value retention.
Industry context matters. The same churn rate can signal strength in one market and weakness in another.
Retention improves through structured experience design. Onboarding, habit formation, value reinforcement, and expansion form a continuous cycle.
Investors look at the shape of retention over time. Stable curves signal product-market fit and scalable growth.

Answers to The 5 Most Searched Questions
-
It depends on the industry. Early AI and EdTech may see higher churn, while Cybersecurity and PropTech are expected to be very low. Context matters.
-
Customer churn counts users lost. Revenue churn shows how much recurring revenue leaves. Revenue churn better reflects the value and stickiness of your product.
-
Most churn happens before habits form. Early onboarding and first-value speed determine whether users stay long enough to experience meaningful outcomes.
-
They look at the retention curve shape, not just a percentage. Stability after initial drop-offs signals product-market fit and defensibility.
-
Clear onboarding, repeated value delivery, regular reinforcement of outcomes, and gradual expansion into additional workflows or features.