Which Fintech Niches Command the Highest Valuation Multiples (and Why It Matters)?
Founder of Finro Financial Consulting. Personally leads every valuation, modeling, and M&A advisory engagement.
View Lior's profile →Startup valuation, financial modeling, and M&A advisory for AI, fintech, and SaaS companies. Serving funded tech startups from pre-seed through pre-IPO.
About Finro →This analysis draws on Finro’s Mid-2025 fintech valuation database covering public comps, private rounds, and M&A benchmarks across infrastructure and application segments.
Not all fintech startups are valued equally. Investors consistently assign higher revenue multiples to certain niches, while others struggle to break through the median.
These differences aren’t random. They reflect underlying variations in business models, growth predictability, capital intensity, and strategic relevance to buyers and investors.
For founders, understanding these patterns isn’t just academic. It can influence how you position your company, which comps you highlight in your deck, and how realistic your valuation expectations are before a fundraise or M&A process.
We analyzed hundreds of fintech companies across seven distinct segments, ranging from payments and credit to infrastructure and crypto, to understand which niches command the highest revenue multiples, what drives the difference, and why it matters.
TL;DR
Topics covered in this article
- The Highest Valuation Multiples in Fintech: A Snapshot
- How Founders and Investors Apply These Multiples
- Related Fintech valuation research and market context
- What Drives These Multiples (and Why Investors Care)?
- What Drives Valuation Differences Between Fintech Niches?
- Want the Full Picture? Download the Fintech Valuation Dataset
- Summary: What the Data Tells Us
- Key Takeaways
- Answers to The Most Asked Questions
The Highest Valuation Multiples in Fintech: A Snapshot
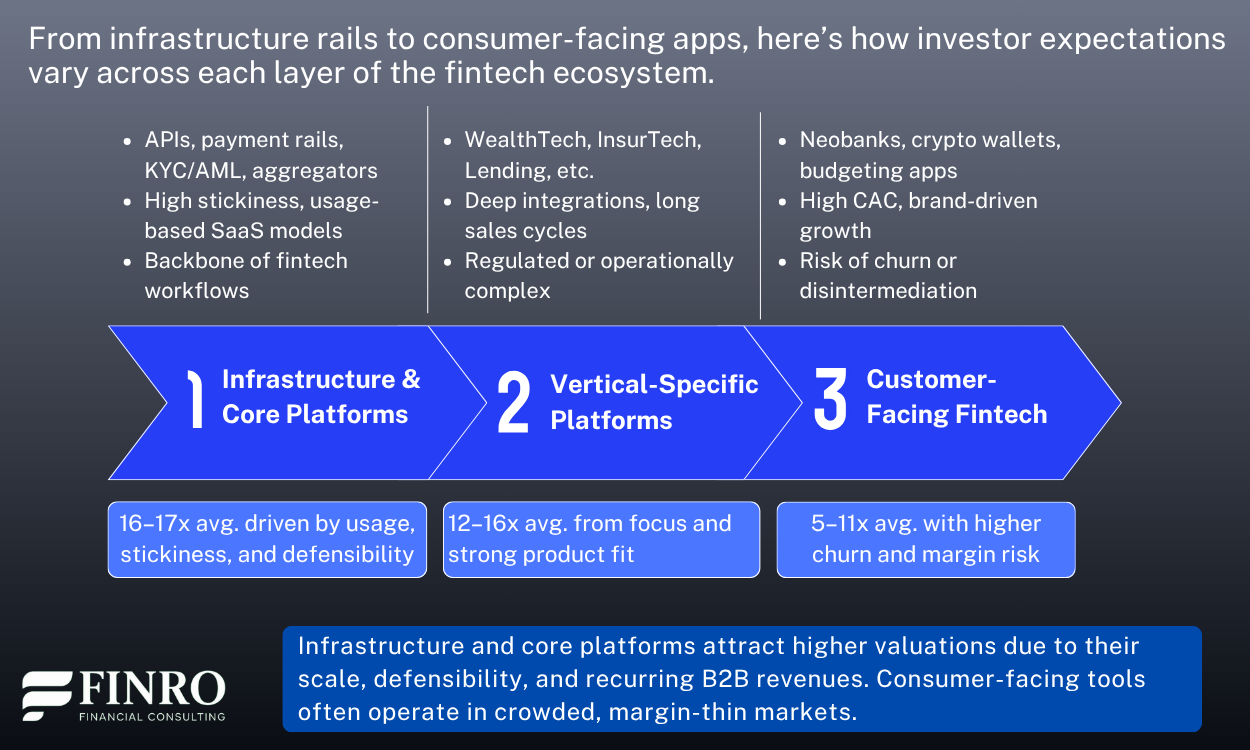
In our latest dataset, infrastructure fintechs top the charts in terms of valuation multiples—averaging 11.2x revenue across public and private companies.
These startups provide APIs, rails, and embedded services that underpin broader financial ecosystems. Their B2B nature, high stickiness, and network effects often translate into strong margins and investor appetite.
Close behind are WealthTech and robo-advisors with an average multiple of 9.1x. These platforms benefit from recurring revenue models, long-term asset retention, and scalable distribution—especially when paired with consumer trust and regulatory licenses.
At the other end of the spectrum, InsurTech and Lending & Credit companies trade at lower multiples, 4.8x and 5.1x, respectively, due in part to capital requirements, slower sales cycles, and thinner margins. Even successful startups in these categories are often compared to traditional financial institutions, which pulls comps downward.
That gap between segments isn’t just cosmetic.
A startup with $10 million in ARR could be worth $50 million or $110 million, depending purely on what it builds and who it sells to.
How Founders and Investors Apply These Multiples
Valuation benchmarks like these rarely sit in isolation. In practice, founders and investors use structured multiples to test fundraising narratives, evaluate strategic options, and align expectations across boards, acquirers, and capital providers.
At Finro, these datasets are integrated into broader valuation advisory engagements, financial models, and M&A positioning work. The objective is not only to reference market ranges, but to understand where a company fits within them — and how shifts in efficiency, growth, and product focus influence valuation outcomes.
Learn more about Finro’s valuation advisory work.
Related Fintech valuation research and market context
What Drives These Multiples (and Why Investors Care)?
Valuation multiples aren’t just market noise. They reflect how investors assess risk, scalability, and long-term returns across fintech niches. While the headline number is easy to quote, the drivers behind it go deeper: revenue quality, capital intensity, and perceived defensibility.
Start with revenue predictability. Payment processors like Adyen and Stripe operate in high-volume markets with strong recurring transaction flows. But investors still assign lower multiples (often 5–7x revenue) compared to API-first players like Plaid or Unit, whose embedded finance infrastructure locks in clients with usage-based pricing. Predictable, sticky revenue boosts multiples.
Gross margin is another key lever. WealthTech firms like eToro or Wealthfront offer scalable platforms with little marginal cost. Often commanding higher multiples than capital-heavy neobanks or lending platforms.
In contrast, digital lenders like Klarna or Affirm, despite strong brand equity, carry lower margins and higher risk, dragging their multiples below the category average.
Then there’s capital intensity. Lending-focused fintechs, whether SME, BNPL, or invoice factoring, tend to raise more capital and generate lower EV-to-funding and revenue multiples. In your dataset, digital lenders average 4.9x revenue, while fintech API players average 7.4x. That gap reflects both working capital demands and exposure to credit cycles.
Lastly, consider timing and regulatory tailwinds. Niches aligned with broader structural shifts — such as compliance automation (e.g. Alloy) or open banking APIs (e.g. Tink) — attract higher investor interest. These players benefit from being perceived as category enablers, which can push multiples into double digits, even at earlier stages.
Valuation multiples are shorthand for deeper dynamics: how a business makes money, how reliably it grows, and how capital efficiently it scales. Investors reward business models that are embedded, high-margin, and defensible, and discount those that are cyclical, cash-intensive, or commoditized.

What Drives Valuation Differences Between Fintech Niches?
Not all fintech companies are valued equally, and that’s not just a function of hype or investor sentiment. Underneath the headline multiples lie structural differences that shape how each niche is perceived, funded, and ultimately valued.
Growth potential is a major driver. Niches like Blockchain, WealthTech, and InsurTech have captured higher average multiples in part because they play in massive, still-evolving markets.
These categories often combine global scale with early-stage penetration — a combination that supports investor optimism, even when current revenues are modest.
Regulatory tailwinds (or headwinds) also matter.
RegTech and Compliance players may not be as flashy, but they benefit from increasing regulatory complexity, especially in Europe and the US.
By contrast, Lending startups can face tighter scrutiny and local licensing bottlenecks, which may depress valuation despite strong topline numbers.
Capital efficiency plays a quiet but important role.
Some niches — like SMB Fintech platforms — can scale more efficiently, with less capital intensity. That leaner growth can be attractive to investors seeking sustainable models.
By contrast, neobanks or crypto exchanges often require large balance sheets and burn through capital to acquire users or meet compliance.
Business model depth influences stickiness and margins.
Subscription-based WealthTech and enterprise fintech tools often enjoy recurring revenue, higher retention, and clearer long-term monetization, all of which push multiples up.
On the other end, transactional businesses like payments platforms may struggle with margin pressure and commoditization, despite impressive volumes.
Finally, investor appetite varies cycle-to-cycle.
At the peak of the 2021 bull run, neobanks and crypto exchanges commanded sky-high valuations.
By 2023–2025, the pendulum shifted toward infrastructure, compliance, and vertical SaaS players. The market’s memory may be short — but recent vintages still reflect these shifting preferences.
Understanding these drivers can help founders, investors, and acquirers benchmark more effectively. It’s not just about where your niche stands, but why it stands there.
Want the Full Picture? Download the Fintech Valuation Dataset
The charts and insights shared above only show part of the story.
The full Finro Fintech Valuation Multiples dataset goes deeper — giving you access to:
360 companies across all fintech verticals, including Payments, Lending, Banking, WealthTech, Crypto, and more
Detailed financials: enterprise value, revenue, funding raised, and calculated EV/Revenue and EV/Funding multiples
Segmented views: by niche, by funding stage, by company status (private, public, acquired)
Cycle-over-cycle trends to help you benchmark realistically and spot valuation shifts early
Whether you’re preparing for a raise, validating your valuation, or mapping the market, this dataset gives you the clarity you won’t get from generic benchmarks.
→ Download the full dataset now (€79.90) and access real valuation data from real fintech companies.

Summary: What the Data Tells Us
Fintech valuation multiples vary significantly by niche — and that variation is anything but random. Payments and Capital Markets tend to trade at lower multiples due to scale constraints and commoditized offerings.
In contrast, Blockchain, WealthTech, and InsurTech often capture higher valuations, driven by growth narratives, tech leverage, and investor appetite.
Still, the dispersion within each niche is just as revealing.
Some startups command 40x+ revenue multiples, while others sit below 1x. Stage, traction, revenue mix, and macro sentiment all shape those outcomes. That’s why relying on “market averages” alone can be misleading.
If you’re a fintech founder, investor, or advisor — you need to go beyond top-line numbers. Understand your niche, your stage, and your position in the market. And benchmark accordingly.
The full dataset of 360 companies is available for download for €79.90 — giving you the real-world numbers behind the noise.

Key Takeaways
1. Blockchain Leads Multiples: Blockchain & Crypto top the list with 17.3x average revenue multiple, signaling strong investor appetite for decentralized fintech models.
2. WealthTech & InsurTech Attract Premiums: WealthTech and InsurTech post ~16x averages, reflecting high scalability and investor belief in tech-driven disruption in traditional finance sectors.
3. Payments and Capital Markets Lag: Payments & Capital Markets show lower multiples (~5–8x), likely due to mature business models and margin compression in competitive environments.
4. Wide Ranges Within Niches: Each niche shows huge valuation spread—some exceeding 80x—showing that product stage, geography, and traction heavily influence investor sentiment.
5. Benchmarks Vary by Niche: There’s no one-size-fits-all in fintech. Smart founders use niche-specific comps when pitching, forecasting, or planning capital strategy.

Answers to The Most Asked Questions
-
It varies by niche, but mid-2025 data shows an average between 8x–17x. Blockchain, InsurTech, and WealthTech top the list with the highest multiples.
-
Blockchain & Crypto, InsurTech, and WealthTech command the highest revenue multiples, reflecting investor appetite for scalable, tech-first disruption in traditionally slow-moving sectors.
-
Multiples vary due to factors like niche maturity, margins, scalability, growth rates, and whether the solution targets consumers, enterprises, or regulated industries.
-
Investors commonly use revenue multiples, comps analysis, and discounted cash flow—tailored by stage, market traction, and the startup’s specific fintech niche.
-
Depends on niche and growth. In Blockchain, 10x may be fair. In Payments, it may be high. Always compare to similar deals.