
What is Average Order Value (AOV)?
By Lior Ronen | Founder, Finro Financial Consulting
Ever wondered why some businesses seem to have that magic touch, turning modest browses into impressive sales?
A big part of the secret sauce is understanding and optimizing a little metric known as Average Order Value, or AOV for short.
At its core, AOV isn’t just about how much cash is flowing in; it’s a snapshot of purchasing behavior and an indicator of how effective your sales strategies are.
Why does AOV matter, you ask?
Well, it's like having a bird's-eye view of your sales health.
A higher AOV means customers aren’t just buying; they’re buying more each time they click 'checkout'.
For any business, especially in e-commerce, getting a handle on this metric can open doors to smarter strategies, from tweaking prices to crafting those irresistible offers that customers can’t ignore.
Stick around as we dive deeper into what AOV is, why it should be on your radar, and how you can nudge those numbers northward.
Whether you're looking to fine-tune your business model or just curious about the mechanics of successful e-commerce, you're in the right place.
Let’s get into it!
Average Order Value (AOV) emerges as a critical metric for e-commerce success, highlighting the average spending per transaction. Its significance lies in offering insights into customer purchasing behaviors and guiding businesses in optimizing sales strategies for revenue enhancement. Key strategies to elevate AOV include upselling, cross-selling, creating bundle offers, setting free shipping thresholds, and launching loyalty programs.
These tactics are aimed at enhancing customer experience and encouraging higher spending per order. Additionally, tracking AOV over time, leveraging A/B testing, and soliciting customer feedback are essential for fine-tuning efforts to increase AOV. Ultimately, a focused approach to understanding and boosting AOV can lead to improved profitability and customer satisfaction, underpinning the long-term success of e-commerce endeavors.
Getting to Know AOV
So, what's the deal with Average Order Value, and how do you even figure it out?
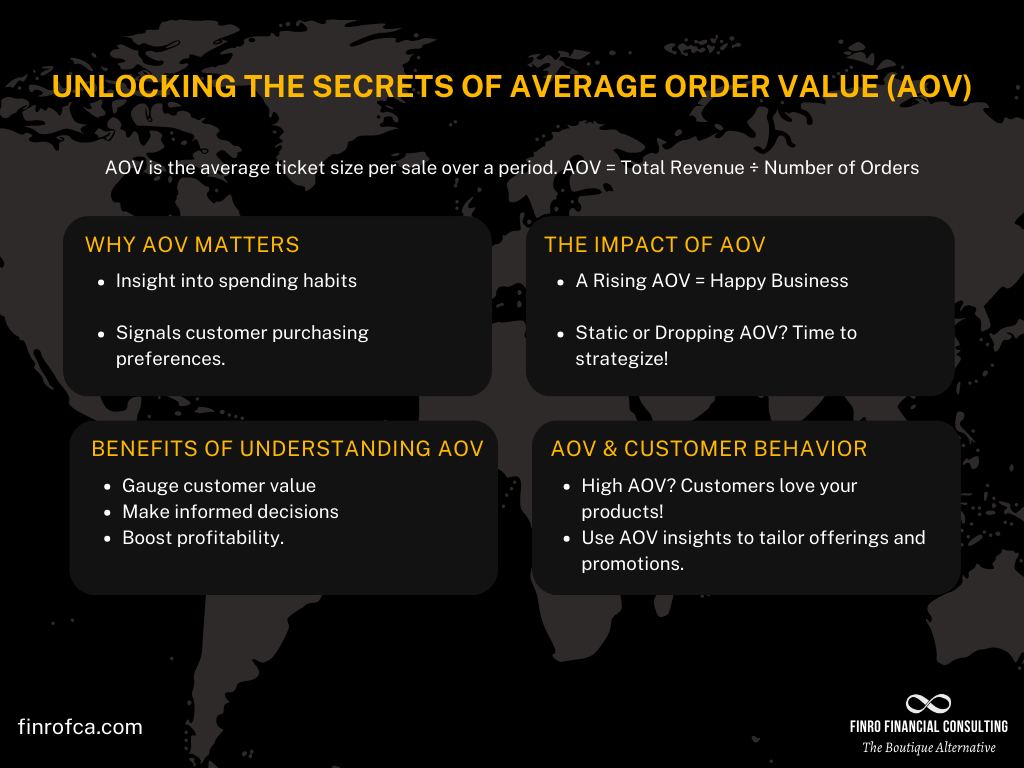
Imagine AOV as the average ticket size of every sale made over a certain period.
It's like looking at a series of checks from a restaurant and figuring out the average amount each customer spent.
Calculating it is straightforward: just divide your total revenue by the number of orders.
Simple, right?
Why AOV Isn't Just Another Number
You might wonder, "Okay, but why should I care about this average?" Here's the scoop: AOV is a powerhouse of insight.
It doesn't just tell you how much people are spending; it gives you clues on how they're spending.
A rising AOV?
That's a pat on the back, indicating your customers are finding more reasons to spend more.
If it's not budging or, dare we say, dropping, it's a nudge to revisit your strategies.
The Magic Behind AOV
Think of AOV as your business's pulse, offering vital signs on its health. It helps you:
Gauge customer value: Understand how much value customers find in your offerings.
Make informed decisions: Data-driven tweaks to pricing, marketing, and product strategies? Yes, please!
Boost profitability: By focusing on increasing the average spend, you're not just chasing sales; you're maximizing the value of each transaction.
AOV and Customer Behavior: A Love Story
One of the coolest things about AOV is its ability to shed light on customer behavior. High AOV often signals that customers are either buying pricier items or adding more to their carts.
Either way, it's good news for you. Understanding these patterns can help tailor your offerings and promotions to encourage even more generous purchases.
The Perks of Keeping an Eye on AOV
So, we've unpacked what AOV is and why it's more than just a fancy acronym. Now, let's explore why keeping a close eye on this metric can be a game-changer for your business.
Boosting Your Bottom Line
First off, AOV is like a compass pointing towards revenue optimization. It helps you identify not just how to get more sales, but how to make each sale count for more.
It’s about finding that sweet spot where customers feel they’re getting incredible value, prompting them to spend a bit extra.
Unveiling Customer Preferences
Then there’s the insight AOV offers into what your customers love and how they shop.
This goldmine of information allows you to customize experiences, tailor promotions, and even adjust your inventory to align with customer preferences.
It’s like having a crystal ball that helps predict what will make your customers’ eyes light up.
Crafting Winning Pricing Strategies
AOV also plays a pivotal role in shaping your pricing strategy.
Understanding the average spend can guide you in setting prices that maximize revenue without deterring customers.
It’s all about balancing act – ensuring your prices are attractive enough to encourage purchases while also pushing that average order value higher.
Fine-Tuning Marketing Efforts
Last but definitely not least, AOV can significantly impact your marketing strategies.
Knowing the average spend per order can help you design promotions that entice customers to add just one more item to their cart.
Whether it's through targeted email campaigns, personalized offers, or strategic discounts, AOV data ensures your marketing dollars are spent wisely, aiming for the highest possible return.
AOV Across the Board: Who's Measuring and How
While Average Order Value is a hero in the e-commerce arena, it's certainly not limited to online shops. A variety of industries find AOV a crucial metric in understanding and optimizing customer transactions. Let's explore who's keeping an eye on AOV and break down the calculation into simple steps.
Who's Tracking AOV?
E-commerce and Retail: The bread and butter of AOV analysis. These sectors use AOV to fine-tune pricing, promotions, and product placement, aiming to increase the basket size of each customer's purchase.
Hospitality and Services: Hotels, restaurants, and service-based businesses monitor AOV to enhance guest experiences and optimize pricing strategies for packages, meals, or additional services.
Subscription Services: From streaming platforms to monthly subscription boxes, these companies track AOV to understand the average revenue per subscription and adjust their offerings accordingly.
B2B SaaS Companies: While not the traditional use case, B2B SaaS businesses analyze AOV in terms of average contract value, helping them understand sales effectiveness and customer value over time.
How to Calculate AOV?
Calculating your Average Order Value is straightforward. Here’s how you do it:
Total Revenue: Start with your total revenue over a specific period. This could be daily, monthly, or annually, depending on your analysis needs.
Number of Orders: Count the total number of orders or transactions during the same period.
Do the Math: Divide the total revenue by the number of orders. The formula looks like this:
AOV = Number of Orders / Total Revenue
A Quick Example
Let’s say your online store made $10,000 in revenue this month from 250 orders. Your AOV would be:
$10,000 / 250 = $40
This means, on average, each customer order brought in $40.
While AOV might seem similar to its distant cousin, ARPU, at first glance, there are significant differences between the two:
| Feature | AOV (Average Order Value) | ARPU (Average Revenue Per User) |
|---|---|---|
| Definition | The average amount spent per order. | The average revenue generated per user or customer over a specific period. |
| Calculation | Total Revenue / Number of Orders | Total Revenue / Number of Users |
| Focus | Order-centric; emphasizes the value of individual transactions. | User-centric; emphasizes the revenue generated from each user or customer. |
| Use Case | Commonly used in e-commerce and retail to optimize sales strategies and product pricing. | Widely used across various industries, including SaaS, telecommunications, and media, to gauge overall customer value and product/service pricing strategy. |
| Insight | Provides insights into purchasing behavior and the effectiveness of sales strategies. | Offers a broader view of customer value, loyalty, and long-term revenue potential. |
| Strategic Impact | Helps in tailoring marketing efforts to increase basket size and optimizing product offerings. | Useful in designing customer retention strategies, evaluating subscription models, and assessing overall business health. |
Factors Influencing AOV
Understanding what can nudge your Average Order Value up or down is key to unlocking strategies that boost your sales and enhance customer satisfaction.
Several factors play into this dynamic, each intertwining with the others to paint the big picture of your business’s performance.
Product Pricing and Mix
The types of products you offer and their pricing strategies are foundational to influencing AOV.
Higher-priced items or strategically bundled products can elevate the average order value, encouraging customers to see the added value in purchasing more or opting for premium options.
Customer Segmentation
Not all customers are created equal when it comes to their spending habits.
Segmenting your customer base can reveal groups that are more likely to make larger purchases either due to their preferences, purchasing power, or how they engage with your brand.
Tailoring your marketing and sales strategies to these segments can significantly impact your AOV.
Marketing and Sales Tactics
The way you market your products and the sales tactics you employ can greatly affect AOV.
Limited-time offers, promotions, and upselling or cross-selling strategies are all powerful tools.
For instance, suggesting related products at checkout or offering a discount on bundles can encourage customers to add more to their carts.
Website Design and User Experience
Never underestimate the power of a smooth shopping experience. An intuitive and engaging website design can guide customers through your product offerings more effectively, increasing the chances of adding additional items to their cart.
Simple navigation, clear product information, and an easy checkout process are all critical elements.
Seasonal Trends and Buying Behavior
Seasons and holidays can also influence AOV, with certain times of the year encouraging more spending, such as during the holiday season, back-to-school period, or Black Friday sales.
Understanding these trends can help you adjust your strategies to maximize AOV during these peak times.
Loyalty Programs and Customer Perks
Offering rewards for repeat purchases or membership perks can also influence AOV.
Customers who feel valued are more likely to increase their order size to take advantage of loyalty points, exclusive offers, or free shipping thresholds.

Strategies to Boost Your Average Order Value
Now that we've explored what influences AOV, let's dive into some actionable strategies you can implement to drive those numbers higher. Increasing your Average Order Value is all about enhancing the customer experience while encouraging them to purchase more or higher-value items. Here are some effective tactics:
Upselling and Cross-selling
Upselling encourages customers to buy a higher-end version of a product they're considering, while cross-selling suggests complementary products that go well with their purchase. Both strategies not only improve customer satisfaction by helping shoppers find what they need but also increase the overall order value.
Implementing the Strategy: Use product pages and checkout to showcase related products or upgrades. Highlight benefits or savings from making the switch to a premium option.
Creating Bundle Offers
Packaging related products together as a bundle often at a slight discount encourages customers to spend more than they initially intended. Bundles are attractive because they offer perceived value, making the purchase seem like a better deal.
Implementing the Strategy: Curate bundles based on popular products or frequently bought together items. Ensure the bundle offers a clear advantage over purchasing items separately.
Setting Free Shipping Thresholds
Offering free shipping for orders above a certain value is a proven tactic to increase AOV. Customers are often willing to add more items to their cart to qualify for free shipping, making it a win-win for both the business and the consumer.
Implementing the Strategy: Determine your free shipping threshold by analyzing your current AOV and shipping costs. Set the threshold slightly above your current AOV to encourage higher-order values.
Launching Loyalty Programs
Rewarding customers for their purchases not only fosters loyalty but also encourages them to spend more to earn rewards. A well-designed loyalty program can significantly impact AOV, as customers feel they are getting more value from their purchases.
Implementing the Strategy: Design a loyalty program that rewards customers for reaching spending thresholds, offering points, discounts, or exclusive perks as incentives.
Leveraging Time-sensitive Promotions
Creating a sense of urgency through limited-time offers or flash sales can motivate customers to make larger purchases than they might under normal circumstances. The key is to make the offer compelling enough that customers see the value in buying more now rather than later.
Implementing the Strategy: Use email marketing, social media, and website banners to promote your time-sensitive offers. Ensure the promotion is easy to understand and the value proposition is clear.
| Strategy | Description | Implementation Tips |
|---|---|---|
| Upselling and Cross-selling | Encourages buying higher-end products or complementary items. | Showcase related products or upgrades on product pages and during checkout. |
| Creating Bundle Offers | Packages related products together at a discount. | Curate bundles based on popularity or items frequently bought together. |
| Setting Free Shipping Thresholds | Offers free shipping for orders above a certain value. | Set the threshold slightly above your current AOV to encourage higher purchases. |
| Launching Loyalty Programs | Rewards customers for their purchases to foster loyalty and encourage spending. | Design a program that rewards customers for reaching spending thresholds. |
| Leveraging Time-sensitive Promotions | Uses limited-time offers to create urgency and motivate larger purchases. | Promote offers through email, social media, and website banners. |
Measuring and Optimizing AOV for Growth
So, you've implemented strategies to increase your Average Order Value. How do you know they're working? Measuring and optimizing AOV isn't a set-it-and-forget-it deal. It requires ongoing attention and adjustment. Here’s how you can stay on top of it:
Tracking AOV Over Time
To truly understand the impact of your efforts, you need to track your AOV consistently over time. This means setting up a system to regularly calculate and analyze this metric. By comparing AOV across different periods, you can gauge the effectiveness of your strategies and identify any trends or patterns.
Implementation Tip: Use analytics tools to automate AOV tracking. Set up dashboards that report AOV daily, weekly, or monthly, depending on your business cycle.
A/B Testing for AOV Optimization
A/B testing, or split testing, is a marketer’s best friend when it comes to optimizing for higher AOV. By testing different strategies on segments of your audience, you can see what truly resonates with your customers and what drives them to increase their order value.
Implementation Tip: Start with testing one variable at a time, like free shipping thresholds, product bundle offers, or upsell prompts. Analyze the results to determine what has the most significant impact on AOV.
Leveraging Customer Feedback
Understanding your customers' experiences and preferences can provide invaluable insights into how to optimize AOV. Feedback can shed light on what customers value, what might be preventing them from adding more to their carts, and what changes could enhance their shopping experience.
Implementation Tip: Conduct surveys, monitor social media, and encourage reviews to gather customer feedback. Use this information to refine your strategies and make data-driven decisions to increase AOV.
Continuous Improvement Cycle
The journey to optimizing AOV doesn't have an endpoint. As market conditions, consumer behavior, and your products or services evolve, so should your strategies for increasing AOV. Embrace a culture of continuous improvement, regularly reviewing your approaches, implementing new tactics, and measuring the outcomes.
Implementation Tip: Schedule regular reviews of your AOV strategies and performance. Be open to experimenting with new tactics and pivoting based on what the data tells you.
By focusing on these areas, you can ensure that your efforts to increase AOV are effective and adapt over time to meet changing business needs and market conditions. Remember, the goal is to create more value for both your customers and your business, fostering a positive cycle of growth and customer satisfaction.

Wrapping It Up: The AOV Advantage
Navigating the e-commerce landscape requires a keen eye on various metrics, but as we've uncovered, Average Order Value (AOV) stands out for its direct impact on revenue and profitability.
By understanding what AOV is, why it matters, and how it can be influenced, businesses can unlock new opportunities for growth and customer engagement.
Remember, AOV isn't just about pushing for higher numbers in isolation. It's about creating a shopping experience that adds value at every turn—encouraging customers not just to buy more, but to feel good about their purchases.
Strategies like upselling, cross-selling, bundling, and crafting compelling offers all play into this, but they must be executed with an understanding of your customers' needs and preferences.
Measuring and optimizing AOV is a continuous journey.
It demands a mix of creativity, analytics, and customer insight.
The businesses that thrive are those that view this process as an ongoing conversation with their customers—one that's always evolving based on feedback, data, and market trends.
As you move forward, keep AOV in your toolkit of key metrics.
Monitor it, experiment with ways to enhance it, and always strive to align your strategies with the ultimate goal of delivering exceptional value to your customers.
In doing so, you'll not just see an uptick in your Average Order Value—you'll build a stronger, more resilient business poised for long-term success.
Here's to elevating your AOV and unlocking the full potential of your e-commerce endeavors!
Key Takeaways
Average Order Value (AOV) is a Vital Metric: AOV provides critical insights into customer purchasing behavior and the effectiveness of sales strategies, making it essential for monitoring the financial health of e-commerce businesses.
Strategies to Increase AOV Enhance Customer Experience: Implementing tactics such as upselling, cross-selling, offering bundle deals, setting free shipping thresholds, and loyalty programs can not only boost AOV but also improve the overall shopping experience for customers.
Understanding Customer Behavior is Crucial: Segmenting customers and understanding their preferences and buying habits allow for targeted strategies that can significantly impact AOV.
Continuous Measurement and Optimization Are Necessary: Regularly tracking AOV, conducting A/B testing for different strategies, and gathering customer feedback are key to identifying the most effective ways to increase AOV over time.
AOV Growth Contributes to Long-term Business Success: By focusing on increasing the average order value, businesses can drive revenue growth and build stronger, more resilient operations, ensuring satisfaction and value for both the company and its customers.
Answers to The Most Asked Questions
-
AOV stands for Average Order Value. It's a metric that indicates the average amount spent per order over a certain period, providing insights into purchasing behavior and the effectiveness of sales strategies.
-
A higher AOV indicates that customers are spending more on each purchase. It suggests that customers are either buying pricier items or adding more to their carts, reflecting positively on the business's sales health and the value customers find in its offerings.
-
AOV is used because it offers a snapshot of purchasing behavior and serves as an indicator of how effective sales strategies are. It helps businesses understand customer value, make informed decisions about pricing, marketing, and product strategies, and ultimately, boost profitability.
-
AOV (Average Order Value) focuses on the value of individual transactions, emphasizing the average amount spent per order. In contrast, ARPU (Average Revenue Per User) emphasizes the revenue generated from each user or customer over a specific period, providing a broader view of customer value, loyalty, and long-term revenue potential.
-
A high AOV is generally considered good as it signifies that customers are spending more per transaction, which can lead to increased revenue and profitability for the business. It reflects successful sales strategies and a high perceived value of the products or services offered.