
Proptech Valuation Multiples Q2 2026: Revenue, Funding, and M&A Benchmarks
Proptech valuation multiples are becoming more selective.
A few years ago, many companies could attract investor attention by digitizing real estate workflows that were still slow, manual, and fragmented. In 2026, that is no longer enough.
The companies earning stronger valuation multiples are not just making real estate processes more digital. They are becoming embedded in the workflows where money actually moves: property transactions, financing, valuation, underwriting, leasing, property operations, and building performance.
That shift matters for founders, investors, and acquirers. A Proptech company’s valuation is increasingly shaped by the quality of the workflow it controls, the depth of its data, the repeatability of its revenue, and the amount of enterprise value it creates relative to the capital it raised.
Finro’s Q2 2026 Proptech valuation dataset includes 230 public companies, private companies, and M&A deals across 9 Proptech niches. The analysis compares EV/Revenue multiples, EV/Funding multiples, funding-stage trends, and M&A benchmarks to show how investors and buyers are pricing the market.
The key message from the data is simple: Proptech is not being priced on digitization alone anymore. The premium is moving toward companies that can control workflows, automate decisions, and create measurable financial value inside the real estate market.
Access the full Q2 2026 Proptech valuation dataset, including public comps, private companies, M&A deals, EV/Revenue, EV/Funding, funding stages, and niche classifications.
-
01Proptech valuation multiples are becoming more selective. The companies earning stronger multiples are not just digitizing real estate workflows. They are becoming embedded in transactions, financing, valuation, leasing, property operations, and building performance.
-
02The average multiple does not tell the full story. Across the dataset, average EV/Revenue is meaningfully above the median, showing that headline Proptech multiples are shaped by premium companies and outliers.
-
03Private, public, and M&A benchmarks reflect different valuation logic. Private markets price future growth and category leadership, public markets price scale and profitability discipline, and M&A buyers price strategic fit, integration value, and workflow control.
-
04AI, data, and transaction workflows are becoming the premium layers. Higher valuation multiples tend to appear where companies own useful data, automate high-value decisions, or sit close to the real estate workflows where money moves.
-
05EV/Funding adds a useful capital efficiency lens. Revenue multiples show how the market prices current revenue quality and growth potential, while EV/Funding shows how much enterprise value was created relative to capital raised.
Topics covered in this article +
- What this Proptech valuation dataset covers
- Proptech valuation multiples: Q2 2026 market snapshot
- Proptech valuation multiples by niche
- Why transaction and financing platforms dominate the benchmark set
- AI and data-driven Proptech is becoming the premium layer
- Private, public, and M&A Proptech multiples tell different stories
- Proptech valuation multiples by funding stage
- Proptech M&A multiples: buyers pay for control points
- Capital efficiency across Proptech niches
- Download the full Proptech valuation dataset
- Key takeaways and answers to the most asked questions
What this Proptech valuation dataset covers
This analysis is based on Finro’s Q2 2026 Proptech valuation dataset, which tracks public companies, private companies, and M&A deals across the Proptech market.
The purpose of the dataset is not only to calculate a single market-wide revenue multiple. That number is useful, but it can also hide the differences between software platforms, transaction infrastructure, property operations, AI-driven tools, investment platforms, and more operational real estate models.
For that reason, the dataset is structured around several valuation lenses. It compares companies by niche, company type, funding stage, revenue multiple, funding efficiency, and M&A activity.
This makes the analysis more useful for valuation work. A founder, investor, or acquirer can look beyond the headline Proptech average and understand which benchmarks are more relevant for a specific company.
Valuation benchmarks like these rarely sit in isolation. In practice, founders and investors use structured multiples to test fundraising narratives, evaluate strategic options, and align expectations across boards, acquirers, and capital providers.
At Finro, these datasets are integrated into broader valuation advisory engagements, financial models, and M&A positioning work. The objective is not only to reference market ranges, but to understand where a company fits within them, and how shifts in efficiency, growth, and product focus influence valuation outcomes.
Learn more about Finro’s startup valuation services.
The snapshot below summarizes what is included in the dataset.
Company-level valuation data across public companies, private companies, and M&A deals, structured by niche, company type, funding stage, and transaction profile.
- EV/Revenue multiples by niche and company type
- EV/Funding multiples for private companies
- Funding-stage analysis from Seed to later stage
- M&A valuation benchmarks by Proptech niche
This article summarizes the main findings. The full dataset includes the company-level data behind the analysis.
View datasetProptech valuation multiples: Q2 2026 market snapshot
Across Finro’s Q2 2026 Proptech dataset, the average EV/Revenue multiple is 10.5x, while the median is 6.8x.
That difference is one of the most important signals in the analysis.
When the average sits meaningfully above the median, it usually means the market is not pricing companies evenly. A limited number of premium companies are pulling the average upward, while the typical company sits at a lower valuation level.
For Proptech, this makes sense. The strongest companies are not just selling software into real estate. They are often embedded in workflows where real economic value is created, such as transactions, financing, valuation, underwriting, leasing, property operations, construction execution, or building performance. These companies can justify stronger multiples because they sit closer to revenue movement, cost reduction, risk reduction, or decision automation.
The companies closer to the median are not necessarily weak. Many may be good businesses. But they are usually priced with more discipline because they operate in categories with slower adoption, heavier implementation, lower software leverage, more operational exposure, or less obvious strategic control.
This is why the average Proptech multiple should be treated as market context, not as a valuation answer. A 10.5x average shows where premium outcomes can land. A 6.8x median gives a more practical starting point for company-level benchmarking.
The same pattern appears in capital efficiency. The dataset shows an average EV/Funding multiple of 6.5x and a median of 3.8x. That means some companies have created substantial enterprise value relative to the capital they raised, while much of the market has produced more moderate value creation.
For founders, investors, and acquirers, the takeaway is simple: Proptech valuation work needs more than one headline multiple. The useful question is not only “what is the average Proptech multiple?” It is which type of Proptech company is being valued, how software-driven the model is, how important the workflow is, and how efficiently the company has converted capital into enterprise value.
Proptech valuation multiples by niche
The niche-level view is where the Proptech valuation analysis becomes more useful.
Across the full dataset, the average EV/Revenue multiple is 10.5x. But that number blends very different business models into one market-wide benchmark. The more important question is where each company sits inside the real estate value chain and how close it is to workflows that create measurable economic value.
Real Estate Transactions and Financing is the largest category in the dataset, with 68 companies and deals. It is also one of the broadest benchmark groups, covering marketplaces, brokerage platforms, mortgage, title, escrow, closing, valuation, and financing workflows. That makes it useful for market context, but not clean enough to use as a direct peer group without narrowing the comparison.
AI and Data-Driven Proptech also shows a strong valuation profile, with a 10.5x average EV/Revenue multiple. The premium is not only about AI exposure. It reflects the value of platforms that turn fragmented property data into decisions around underwriting, valuation, listings, lending, operations, and asset management.
Property Management and Rental Solutions looks more balanced. The niche has 36 companies and deals, with a 9.5x average EV/Revenue multiple. Private companies in the category average 11.6x, while public companies and M&A deals sit lower. That suggests recurring property operations software is valuable, but buyers and public markets still apply discipline around scale, retention, and operating leverage.
Construction and Development Tech shows a different pattern. The overall average is 8.4x, but M&A deals in the niche average 11.7x. That suggests strategic buyers may be willing to pay more for platforms that reduce project risk, control development workflows, or become embedded in construction execution.
Sustainable and Green Proptech has the highest average multiple at 24.0x, but this should be read carefully because the sample is small. The high average may reflect a limited number of premium assets rather than a broad market-wide valuation level for every sustainability-focused Proptech company.
The practical takeaway is that Proptech valuation is not only about the category label. Higher multiples tend to appear where companies control important workflows, own useful data, reduce transaction friction, or create measurable financial value for real estate operators, investors, lenders, or property owners.
Why transaction and financing platforms dominate the benchmark set
Real Estate Transactions and Financing is the largest niche in Finro’s Q2 2026 Proptech dataset, with 68 companies and deals.
That size matters because the category sits close to the part of real estate where financial value is most visible. Search, brokerage, mortgage, title, escrow, valuation, closing, and financing workflows are all connected to transaction volume, capital movement, risk assessment, or deal execution.
But this category also needs careful interpretation.
A digital brokerage platform, a mortgage automation company, a property valuation tool, a closing workflow platform, and a financing marketplace may all belong in the same broad niche. That does not mean they should all trade at the same multiple.
The dataset shows this clearly. Real Estate Transactions and Financing has an average EV/Revenue multiple of 11.2x, above the overall Proptech average of 10.5x. Private companies in the niche average 13.5x, while public companies average only 3.2x and M&A deals average 9.0x.
That spread is one of the more useful findings in the analysis.
Private markets appear to be pricing transaction and financing platforms for future market position, workflow expansion, and category leadership. Public markets are applying more discipline to mature platforms that face revenue cyclicality, housing-market exposure, margin pressure, or lower growth expectations. M&A buyers sit between the two, paying more than public market levels where the target adds strategic value, but generally below the private-market premium.
For valuation work, this means Real Estate Transactions and Financing is a strong reference category, but not a clean peer group by itself. The company’s actual position in the transaction flow matters more than the category label.
The strongest multiples are more likely to apply where a company controls a high-friction workflow, reduces transaction failure, improves underwriting or valuation accuracy, speeds up closing, or becomes difficult to replace once adopted by agents, lenders, buyers, sellers, or institutional real estate operators.
This niche spans several parts of the real estate transaction flow, so valuation benchmarks become more useful when companies are grouped by workflow position rather than by the broad category alone.
The category is useful as a broad Proptech benchmark, but company-level valuation should be narrowed by revenue model, workflow position, customer type, market exposure, and role in the transaction flow.
Want the full list of transaction and financing Proptech companies in the dataset?
View the full datasetAI and data-driven Proptech is becoming the premium layer
AI and Data-Driven Proptech is one of the clearest examples of how valuation premiums are shifting toward decision infrastructure.
The value in this niche is not just that companies use AI. The stronger valuation logic comes from what these platforms can do with fragmented real estate data.
Real estate decisions often depend on inconsistent property records, market data, ownership information, transaction history, listing data, tenant behavior, building performance, valuation inputs, and local market signals. Companies that can organize this data and turn it into faster, better decisions can become valuable across multiple parts of the real estate market.
That is why AI and data-driven platforms often sit across more than one workflow. They can support valuation, underwriting, collateral analysis, property intelligence, listing automation, lending decisions, portfolio management, leasing, and property operations.
In Finro’s Q2 2026 dataset, AI and Data-Driven Proptech has an average EV/Revenue multiple of 10.5x. Private companies in the category average 11.6x EV/Revenue, while M&A deals average 7.1x. This spread suggests that private investors are still pricing future data advantage and automation potential more aggressively than acquirers.
But the premium is not automatic.
A company does not deserve a higher multiple simply because it adds AI to a real estate workflow. The stronger valuation case appears when the platform owns useful data, improves a high-value decision, reduces manual review, creates workflow dependency, or becomes difficult to replace once adopted.
For valuation work, this distinction matters. AI/Data-Driven Proptech should not be benchmarked only against generic software companies or generic Proptech averages. The more useful question is whether the company has a defensible data layer, a clear decision-making role, and revenue that can scale without becoming heavily services-driven.
The strongest AI/Data-Driven Proptech companies are not valued only for automation. They are valued when they improve decisions, reduce friction, or become embedded in high-value real estate workflows.
Platforms that organize ownership records, asset-level data, transaction history, market signals, and property attributes into usable intelligence.
Tools that improve pricing, risk scoring, collateral analysis, underwriting workflows, and real estate investment decisions.
AI tools that support listing creation, lead qualification, document review, transaction coordination, and closing-related workflows.
Systems that support leasing, maintenance, tenant workflows, portfolio monitoring, asset performance, and operating decisions.
Platforms that use building, energy, occupancy, or operational data to improve performance, reduce cost, and support sustainability goals.
AI/Data-Driven Proptech earns stronger valuation support when the product becomes part of a recurring decision workflow, not when AI is added as a thin feature layer.
Want to see the AI and data-driven Proptech companies behind the benchmark?
View the full dataset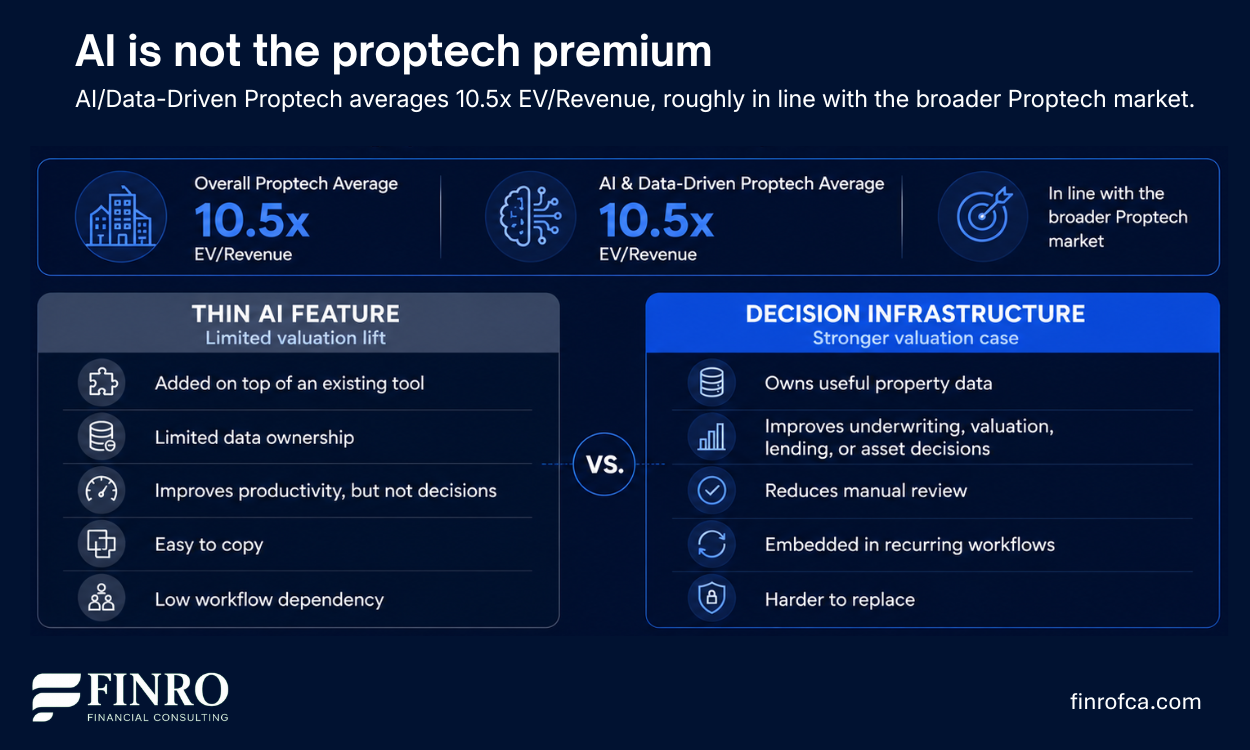
Private, public, and M&A Proptech multiples tell different stories
One of the clearest patterns in the dataset is the gap between private, public, and M&A valuation multiples.
Across the full dataset, private Proptech companies average 12.1x EV/Revenue, compared with 4.0x for public companies and 7.5x for M&A transactions.
That gap does not mean one benchmark is correct and the others are wrong. It means each market is pricing a different version of risk.
Private markets usually price future potential. Investors may be willing to pay higher revenue multiples when they believe a company can become a category leader, expand into adjacent workflows, control valuable data, or grow into a larger market position over time.
Public markets are more disciplined. Public Proptech companies are judged on current revenue quality, growth durability, profitability, capital efficiency, housing-market exposure, and investor sentiment. That is why public multiples are often lower, even when the companies are larger and more mature.
M&A sits between the two. Buyers may pay strategic premiums when a target strengthens their workflow control, expands their product suite, gives them access to data, or improves their position in the real estate value chain. But acquirers also need to underwrite integration risk, synergy realization, customer overlap, and near-term financial contribution.
For valuation work, this matters because private, public, and M&A multiples should not be blended without context. A private Proptech company raising capital may look to private-company multiples for growth-stage expectations, but public comps and M&A deals are often more useful for grounding the valuation in market discipline.
The best benchmark is usually not the highest multiple. It is the peer set that reflects the company’s business model, revenue quality, maturity, buyer universe, and role in the real estate workflow.
Proptech valuation multiples by funding stage
Funding stage adds another useful lens to Proptech valuation, but it should not be read too mechanically.
In theory, valuation multiples should become more grounded as companies move from Seed to Series A, Series B, Series C, and later stages. Early-stage companies are usually priced more on market potential, team quality, product direction, and expected growth. Later-stage companies are expected to show stronger evidence of revenue scale, repeatable customer acquisition, retention, margin structure, and capital efficiency.
The Proptech dataset shows a more nuanced pattern.
Revenue multiples do not rise in a straight line by funding stage. Seed-stage companies average 10.4x EV/Revenue, Series A companies average 11.5x, Series B companies average 12.4x, Series C companies average 13.9x, and Series D+ companies average 10.2x.
That pattern matters because the highest average does not necessarily represent the strongest valuation benchmark. Series C has the highest average, but Series B has the highest median EV/Revenue multiple at 10.2x and the highest upper-quartile level at 17.0x. This makes Series B one of the more important validation points in the dataset.
By Series B, a Proptech company is usually expected to have moved beyond concept risk. Investors can start assessing whether customers are adopting the product repeatedly, whether the revenue model is scalable, and whether the company is becoming embedded in a workflow that matters.
This is especially important in Proptech because many companies operate in markets with slower adoption cycles, fragmented customers, local execution requirements, or exposure to real estate conditions. A later funding stage does not automatically mean a stronger multiple. The company still needs to prove that growth can scale without becoming too operationally heavy.
For valuation work, the funding-stage lens is useful, but only when combined with niche-level benchmarking. A Series B AI property intelligence platform, a Series B construction workflow tool, and a Series B co-living platform may all be at the same funding stage, but the valuation logic behind each one can be very different.
Funding stage helps explain valuation maturity, but the dataset shows that Proptech multiples do not rise in a straight line from Seed to later-stage companies.
Series C shows the highest average EV/Revenue multiple, but Series B has the strongest median and highest upper-quartile range. That makes Series B a useful validation point for Proptech companies that have moved beyond concept risk and can show repeatable adoption.
Need company-level valuation benchmarks by funding stage?
View the full datasetProptech M&A multiples: buyers pay for control points
Proptech M&A multiples need to be read differently from private-company valuation multiples.
Private investors can price a company based on future growth, category leadership, and the possibility that the company becomes a major platform over time. Acquirers usually apply a more specific lens. They need to understand what the target adds to their existing business, how it integrates, and whether the acquisition strengthens a strategic position that would be hard to build internally.
Across Finro’s Q2 2026 dataset, Proptech M&A deals average 7.5x EV/Revenue, with a median of 8.4x. That places M&A pricing below the average private-company multiple, but above the average public-company multiple.
That middle position makes sense.
Buyers are usually more disciplined than private investors because they need to underwrite integration risk, customer overlap, product fit, revenue quality, and synergy potential. But they may still pay above public-market benchmarks when the target gives them access to a valuable workflow, data layer, customer base, or product capability.
The M&A activity in the dataset is concentrated around practical parts of the real estate value chain. Real Estate Transactions and Financing is the largest M&A category, followed by Property Management and Rental Solutions, AI and Data-Driven Proptech, and Co-Living and Shared Spaces.
That pattern suggests buyers are not acquiring Proptech companies only because they want category exposure. They are buying control points: transaction workflows, operating systems, proprietary data, automation layers, and platforms that expand their reach inside real estate operations.
For valuation work, this matters because M&A multiples can reflect strategic value that is not visible in standalone revenue alone. A target may look expensive on a revenue multiple basis if it gives the buyer a workflow position, data asset, or integration advantage that would be difficult to replicate organically.
Proptech acquirers often pay for strategic control points rather than simple category exposure. The value usually sits in workflows, data, operating reach, or automation layers that strengthen the buyer’s position.
Buyers may acquire platforms that sit inside search, brokerage, mortgage, title, escrow, valuation, or closing workflows because these assets give them more control over transaction execution.
Property management and rental platforms can help acquirers expand their reach across leasing, tenant workflows, maintenance, owner reporting, community management, and recurring operations.
AI and data-driven targets may be valuable because they improve underwriting, valuation, property intelligence, risk assessment, portfolio decisions, or market visibility.
Acquirers may pay a premium for products that automate document review, transaction coordination, leasing, diligence, reporting, or other repetitive processes inside real estate operations.
This is why Proptech M&A multiples can differ from standalone revenue benchmarks. Strategic value often depends on what the target helps the buyer control after the acquisition.
Want the full Proptech M&A deal list and valuation benchmarks?
View the full datasetCapital efficiency across Proptech niches
evenue multiples show how the market prices current revenue and growth potential. But they do not show how much capital was required to create that value.
That is why EV/Funding is useful in Proptech valuation analysis.
A company can trade at a high EV/Revenue multiple and still be capital-intensive. Another company may have a more moderate revenue multiple but show stronger capital efficiency if it created meaningful enterprise value with less funding.
This distinction matters in Proptech because the market includes both software-led platforms and more operational models. Some companies scale through recurring software workflows. Others require local teams, physical operations, market-by-market expansion, contractor networks, financing capacity, or real estate execution.
Across Finro’s Q2 2026 dataset, the average EV/Funding multiple is meaningfully above the median. That shows capital efficiency is uneven across the market. A limited number of companies created outsized enterprise value relative to funding raised, while much of the market sits closer to a more conservative benchmark.
The most useful reading is not simply which niche has the highest EV/Funding multiple. The better question is whether the business model can convert capital into durable value without becoming too operationally heavy.
For founders, this matters because raising more capital does not automatically improve valuation quality. Investors and buyers eventually look at what the company built with that capital: revenue scale, workflow adoption, data assets, customer retention, and operating leverage.
For investors and acquirers, EV/Funding helps identify whether a high valuation multiple reflects genuine value creation or simply a capital-heavy path to growth.
EV/Revenue shows how the market prices revenue. EV/Funding shows how much enterprise value was created relative to the capital raised. Reading both together gives a better view of valuation quality.
The strongest profile. These companies command premium revenue multiples and have created meaningful enterprise value relative to capital raised.
These companies may attract strong revenue multiples, but the path to value creation required significant funding, heavier execution, or more operational infrastructure.
These companies may not receive premium revenue multiples, but they have converted capital into enterprise value efficiently and may deserve closer peer-level review.
This profile suggests more limited valuation support, weaker capital conversion, or a business model that still needs stronger proof of scalability and operating leverage.
EV/Revenue lens Useful for understanding how the market prices revenue quality, growth potential, workflow importance, and strategic position.
EV/Funding lens Useful for understanding whether the company created enterprise value efficiently or required a capital-heavy path to scale.
Want to compare Proptech valuation and capital efficiency at the company level?
View the full datasetDownload the full Proptech valuation dataset
This article summarizes the main valuation patterns from Finro’s Q2 2026 Proptech analysis, but the most useful benchmarking work happens at the company level.
A single market-wide Proptech multiple is rarely enough for valuation work. The relevant peer set depends on the company’s niche, business model, funding stage, revenue quality, funding history, and whether the benchmark comes from public markets, private funding rounds, or M&A transactions.
That is why the full dataset includes the underlying company-level data used to build this analysis.
The downloadable file includes 230 Proptech companies and M&A deals across 9 niches, with valuation metrics, company type, funding stage, transaction data, and niche-level classification. It is designed for founders, investors, advisors, and analysts who need more than a headline multiple.
Use it to compare Proptech companies by segment, review public and private valuation benchmarks, analyze M&A transaction multiples, and support valuation work with a more structured peer set.
The full Proptech Valuation Multiples Dataset is available for €79.90.
Access the full Q2 2026 Proptech valuation dataset, including public comps, private companies, M&A deals, EV/Revenue, EV/Funding, funding stages, and niche classifications.
- 1 Proptech valuation multiples are becoming more selective. Stronger multiples are concentrated around companies that control workflows, own useful data, automate decisions, or sit close to financial activity inside the real estate value chain.
- 2 The average Proptech revenue multiple is higher than the median. Finro’s Q2 2026 dataset shows an average EV/Revenue multiple of 10.5x and a median of 6.8x, which means headline averages are pulled upward by premium companies and outliers.
- 3 Private, public, and M&A benchmarks tell different valuation stories. Private companies average 12.1x EV/Revenue, public companies average 4.0x, and M&A deals average 7.5x because each market prices a different version of growth, risk, liquidity, and strategic value.
- 4 Funding stage helps, but it does not explain valuation by itself. Series B is an important validation point in the dataset, but stage should still be read together with niche, revenue quality, workflow depth, capital efficiency, and business model structure.
- 5 AI and data-driven Proptech is becoming a premium valuation layer. The premium is stronger when a company owns useful data, improves high-value decisions, reduces manual review, or becomes embedded in recurring real estate workflows.
- 6 EV/Funding adds discipline to Proptech valuation analysis. Revenue multiples show how the market prices revenue, while EV/Funding shows how much enterprise value was created relative to the capital raised.